Figure 2.
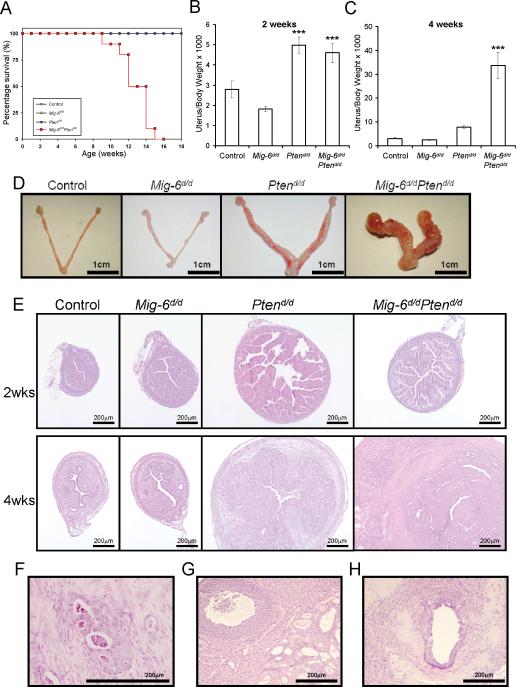
Development of endometrial cancer in Mig-6d/dPtend/d mice. (A) Survival curve in control (PRcre/+, Mig-6f/f, Ptenf/f, and Mig-6f/fPtenf/f), Mig-6d/d, Ptend/d, and Mig-6d/dPtend/d mice. p < 0.0001, logrank test. (B and C) The ratio of uterine weight to body weight in control, Mig-6d/d, Ptend/d, and Mig-6d/dPtend/d mice at 2 (B) and 4 (C) weeks of age. ***, p < 0.001, one-way ANOVA followed by Tukey's post hoc multiple range test. (D) Gross anatomy of control, Mig-6d/d, Ptend/d, and Mig-6d/dPtend/d mice at 4 weeks of age. (E) Histology of uteri from mice with Pten and Mig-6 ablation. H&E staining of control, Mig-6d/d, Ptend/d, and Mig-6d/dPtend/d mice at 2 and 4 weeks of age. (F) Endometrial cancer that has invaded through the myometrium. (G and H) Endometrial cancer that has metastasized into the ovary (G) and skeletal muscle (H).

