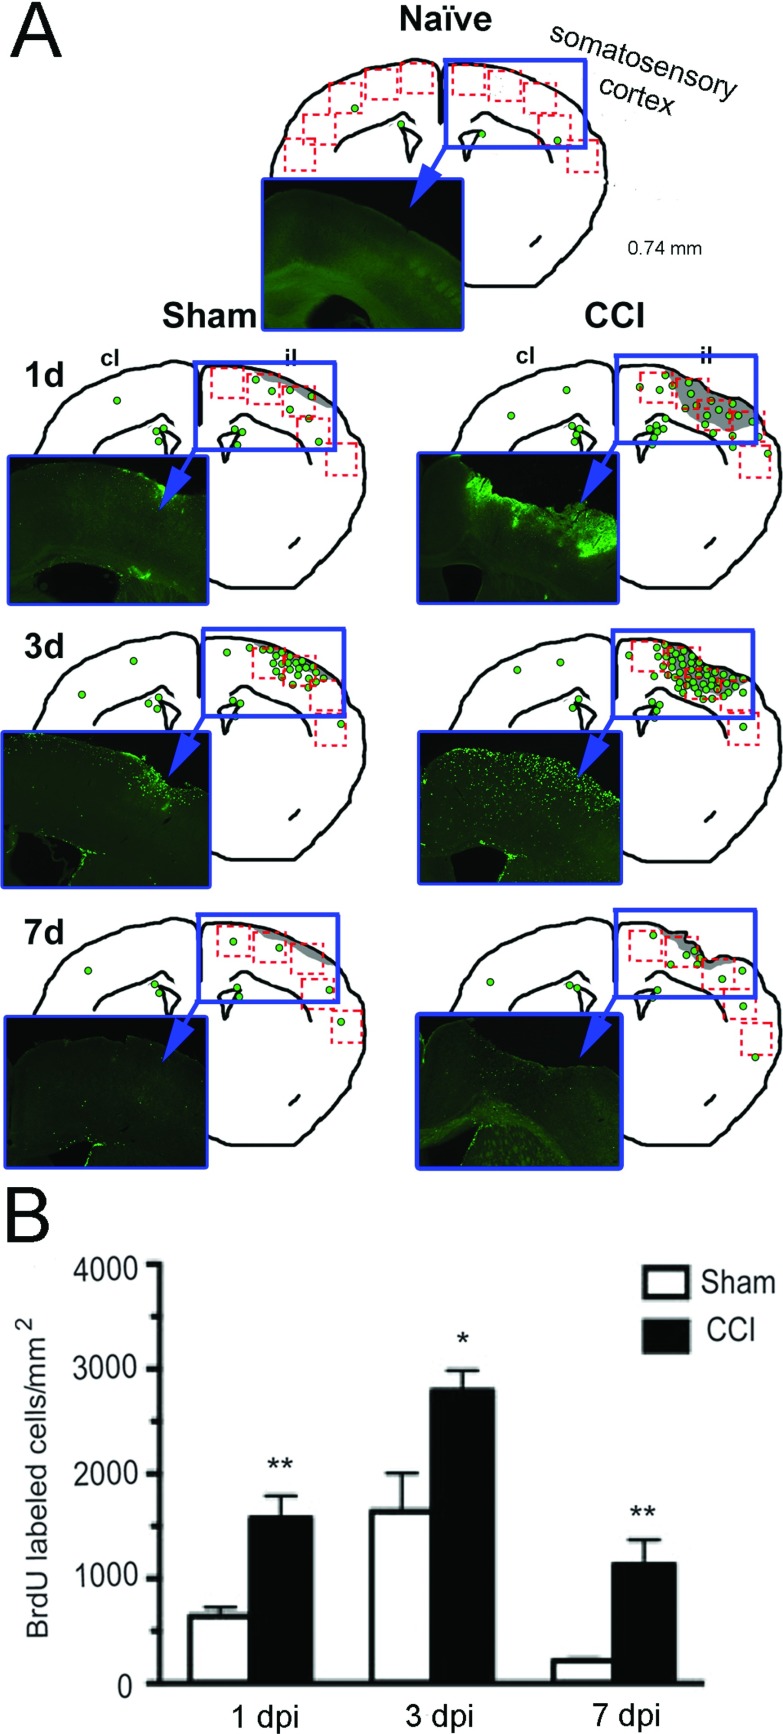
Figure 1. Time course of cortical cell proliferation after CCI injury.
(A) Representative drawings of a mid-brain section (at +0.74 mm from Bregma) indicating the distribution of BrdU+ cells (green circles) in coronal sections of mouse brain at different time points after sham or CCI injury to the somatosensory cortex. The lesion in the right cortex is shown in light gray. The red boxes indicate the five contiguous cortical fields where BrdU+ cells were counted. A representative photomicrograph (within blue insets) show actual BrdU+ staining. (B) Quantification of total number of BrdU+ cells around the cortical injury site in mouse brain after sham or CCI at 1, 3 or 7 dpi. A significant increase in BrdU-labeled cells in the CCI-injured mice compared with sham mice was found at all time points with a peak at 3 dpi (mean±S.E.M., n=3–6,*P<0.05; **P<0.01). CCI, controlled cortical impact injury; il, ipsilateral hemisphere; cl, contralateral hemisphere.

