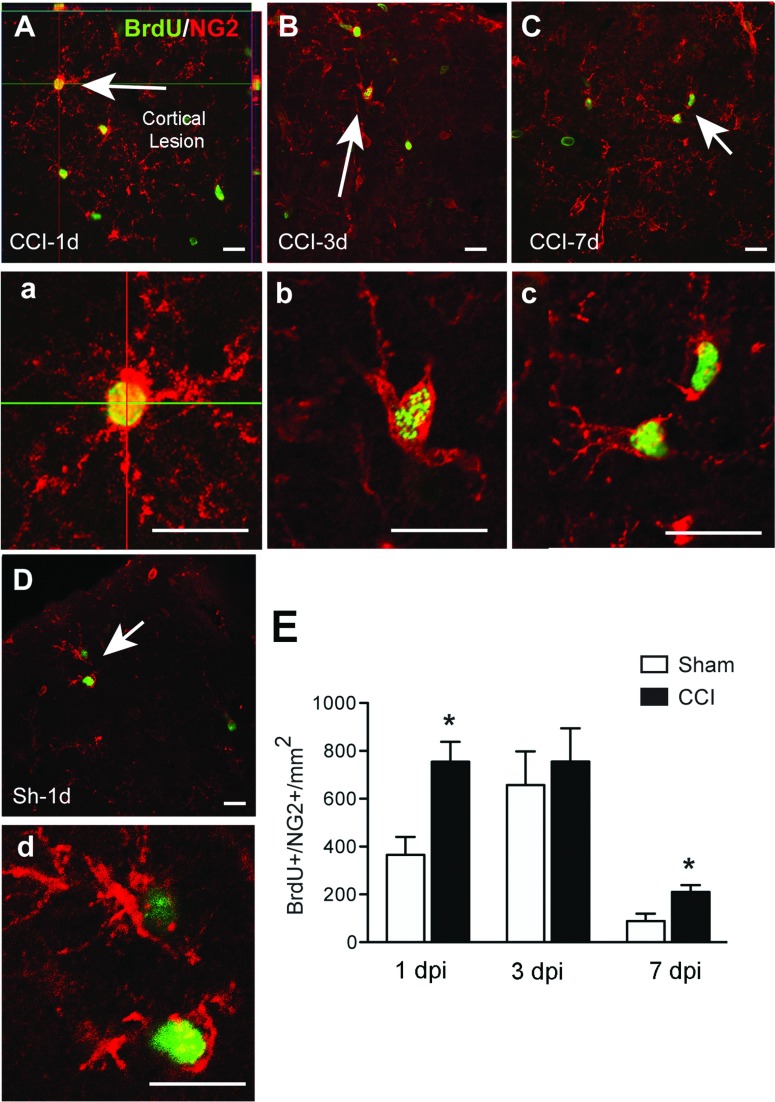
Figure 4. NG2 colocalizes with BrdU after CCI injury.
Confocal images show localization of proliferating NG2+ cells (NG2+, red; BrdU+, green) around the cortical site of injury at 1, 3 and 7 dpi. Proliferation of these cells was highest at 1 (A, a) and 3 dpi (B, b), although it was also high in sham brains (D, d). Proliferation of NG2+ cells decreased by 7 dpi (C, c). Arrows indicate cells shown at larger magnification in their corresponding panels. Scale bar=50 μm (A, B, C and D) and 20 μm (a, b, c and d). (E) Quantification of NG2+/BrdU+ cells at different time points after CCI or sham injury (mean±S.E.M., n=3–6). *P<0.05, by two-tailed Student's t test comparing sham and CCI at each time point.

