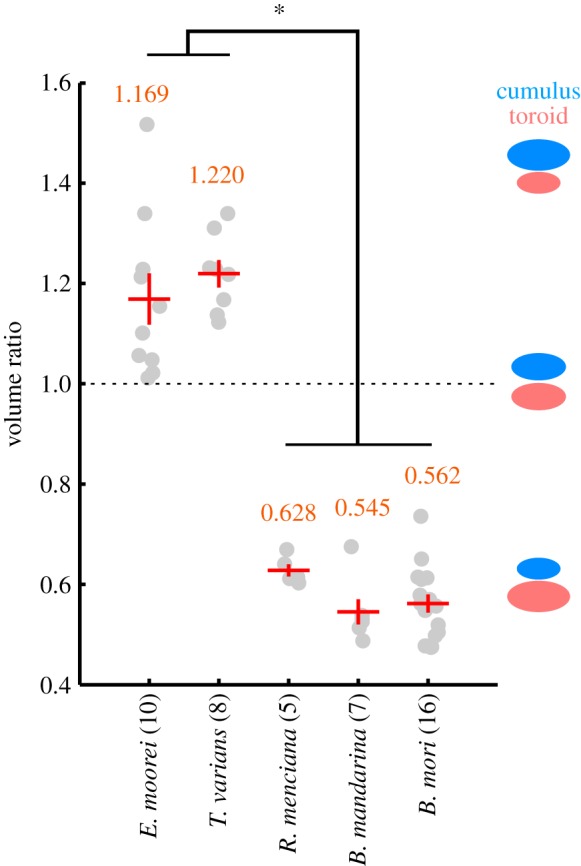
Figure 2.

Comparison of cumulus–toroid volume ratio. Relative volume values were obtained as the absolute volume of the cumulus divided by that of the toroid. Grey circles represent the value for individual samples. Red symbols represent mean ± s.e.m. Average values are indicated in orange. Volume ratio larger than 1 means a cumulus that is larger than the toroid and vice versa. Bombyx mori, B. mandarina and R. menciana showed significantly lower value than E. moorei and T. varians. *p < 10−15, analysis of variance followed by Scheffe's F-test.
