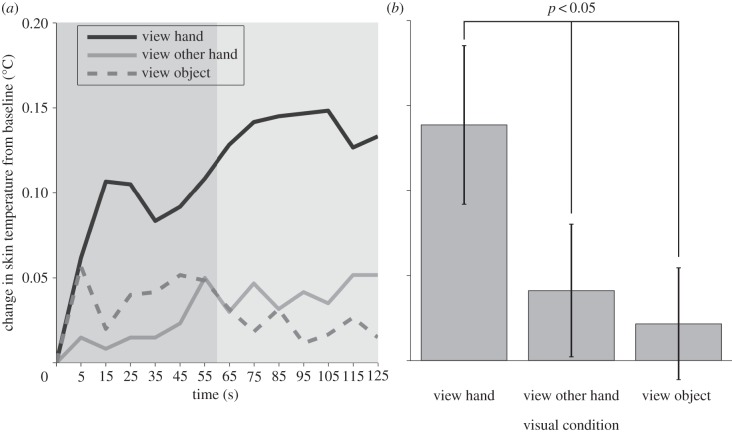
Figure 1.
Changes in the left hand dorsum skin temperatures (experiment 1). (a) The time course of temperature change compared to the baseline measure taken at the start of each block. The analysis focused on test period (light grey). (b) Mean temperature increase in test period across experimental conditions. Error bars are 1 s.e.m.

