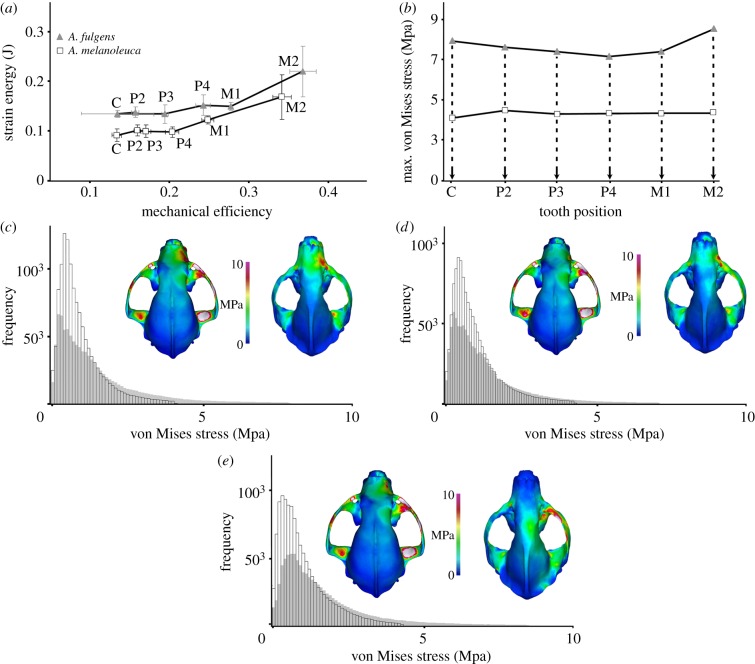
Figure 1.
(a) ME on SE of Ailurus (volume-scaled) and Ailuropoda cranium models. The grand mean of all resolution models is shown; (b) mean maximum VM stress for each simulated bite in the original-size models; (c–e) histograms (grey, Ailurus; white, Ailuropoda) showing the frequency of elements to a given value of VM stress and dorsal view of VM stress distribution in the original-size Ailurus (left) and Ailuropoda (right) models for the bite simulated at the canine (c), fourth premolar (d) and second molar (e). The maximum on the scale is 10 MPa. All results are for unilateral bites using the right side of the dentition. Model results scaled to identical length. See also the electronic supplementary material, figure S4.

