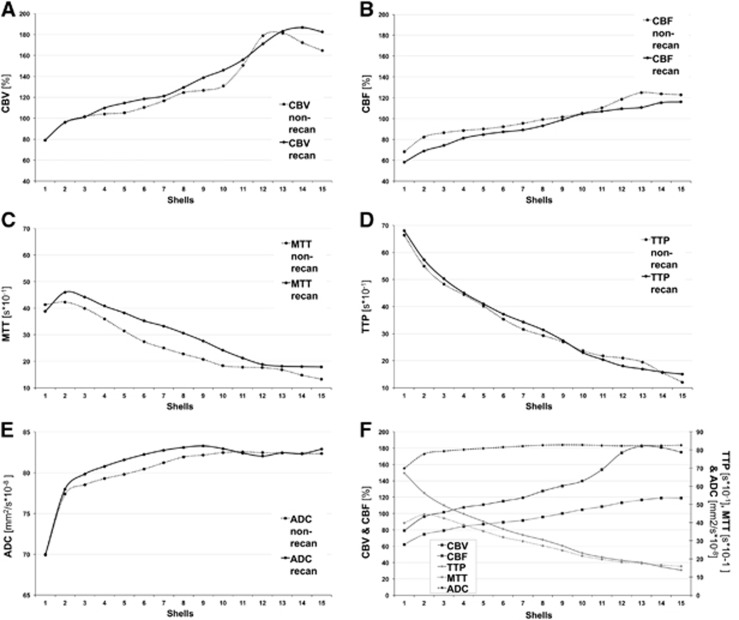
Figure 2.
Relative values of perfusion parameters such as (A) cerebral blood volume (CBV), (B) cerebral blood flow (CBF), (C) mean transit time (MTT), and (D) time to peak (TTP) as well as (E) apparent diffusion coefficient (ADC) displayed for each patient group (recanalized group (recan) and nonrecanalized group (non-recan) within each segment from center (segment 1) to periphery (segment 15) of the three-dimensional shell model). Mean relative values of perfusion parameters and ADC for all patients (F).

