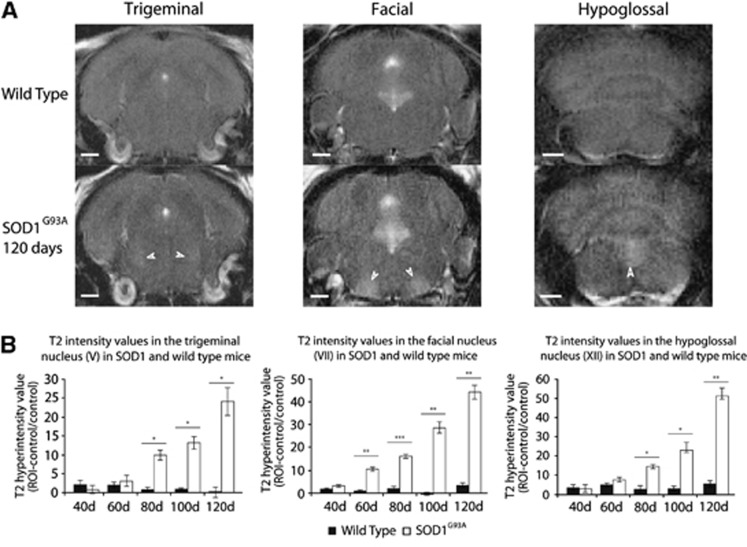
Figure 2.
Comparison of T2 changes in motor nuclei V, VII, and XII in SOD1G93A and wild-type (WT) mice. Representative T2 images of WT and SOD1G93A mice at 120 days (A) in nuclei V (left panels), VII (middle panels), and XII (right panels) show a marked signal enhancement in SOD1G93A mice, compared with surrounding brainstem. Quantification of signal change in the regions of interest (ROIs) compared with surrounding brainstem region (B) shows an early (60 days in nucleus VII) and progressive increase in signal in SOD1G93A but not in WT mice. *P<0.05; **P<0.01; ***P<0.001. N=4 in each group. Scale bars represent 1 mm. SOD1, superoxide dismutase.

