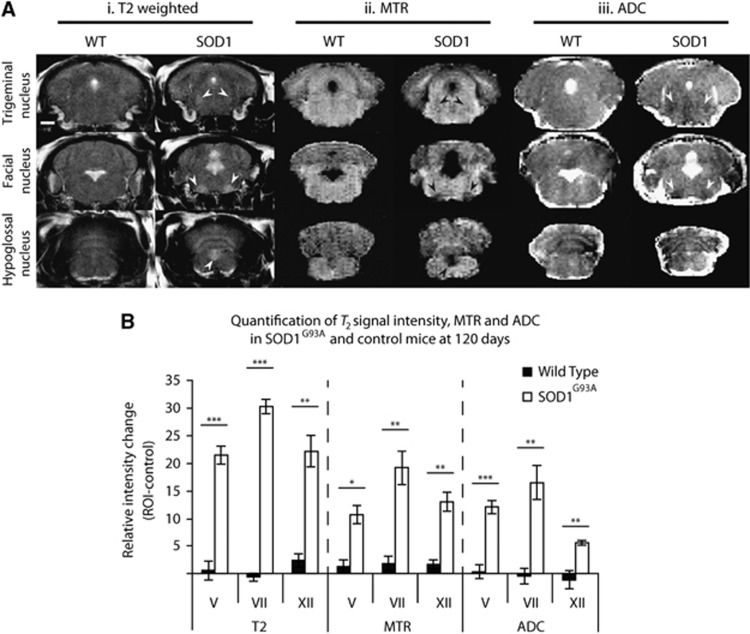
Figure 3.
Comparison of T2, magnetization transfer ratio (MTR), and apparent diffusion coefficient (ADC) sequences in SOD1G93A and control mice at 120 days. Representative images from T2 (i), MTR (ii), and ADC (iii) sequences (A) showed visible changes in SOD1G93A mice for all nuclei (arrows) except for nucleus XII for ADC. Quantification of intensity changes in T2, MTR, and ADC sequences in SOD1G93A and control mice (B) indicate that a significant intensity change occurred for all three nuclei in all sequences. Note that intensity change for ADC and MTR has been inverted for comparison with T2. *P<0.05; **P<0.01; ***P<0.001. N=5 in each group. Scale bar represents 1 mm, and applies to all images. SOD1, superoxide dismutase; ROI, region of interest.

