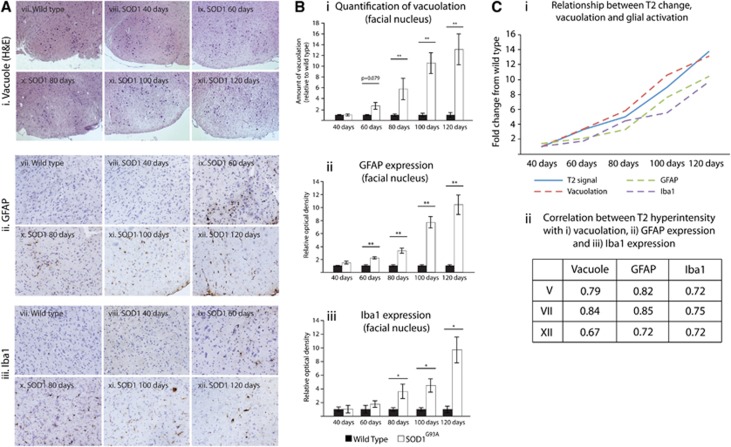
Figure 4.
Relationship between T2 signal change with vacuolation, astrocyte activation (GFAP), and microglia activation (Iba1). Representative images are shown for vacuolation (H&E) (i), and GFAP (ii), and Iba1 (iii) immunoreactivity in wild type (WT) mice and SOD1G93A throughout the disease in the facial nucleus (A). Hematoxylin counterstain was used for immunostaining. (B) Quantification of these disease features showing an increase in vacuolation (i), GFAP staining (ii), and Iba1 staining (iii) in the facial nucleus over from 60/80 days to 120 days. By plotting fold change in T2 hyperintensity, vacuolation, and GFAP/Iba1 immunoreactivity (Ci), we can see a similar relationship between T2 intensity changes with all three variables (vacuolation, GFAP, and Iba1). In line with this, there is a high correlation coefficient (Pearson's r) for the relationship with T2 intensity change for vacuolation, GFAP immunoreactivity, and Iba1 immunoreactivity in all three cranial nuclei (V, VII, and XII) (Cii), with no significant difference between the correlation coefficients in each of these regions (P>0.05). *P<0.05; **P<0.01, GFAP, glial fibrillary acidic protein; Iba1, ionized calcium-binding adapter molecule 1; SOD1, superoxide dismutase.

