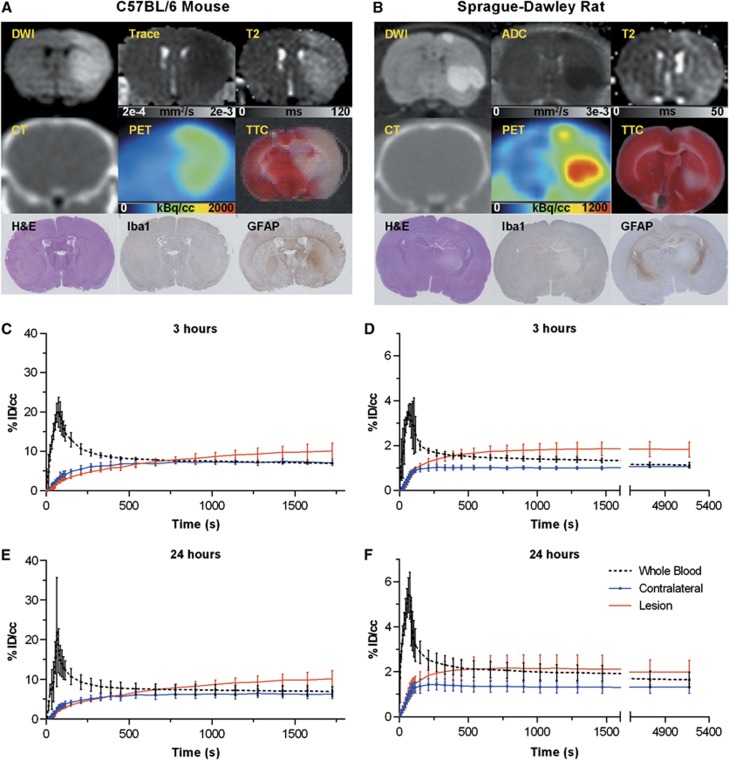
Figure 2.
(A and B) Example multi-modal data for mouse (24 hours post insult) and rat (3 hours post insult). A z-axis apparent diffusion coefficient (ADCz) map was generated in one rat, shown here. (C and D) Averaged time-activity curves for whole blood, brain lesion, and brain contralateral regions of interest for 3 hours and (E and F) 24 hours time points. DWI, diffusion weighted image; GFAP, glial fibrillary acidic protein; H&E, hematoxylin and eosin; Iba1, ionized calcium-binding adapter molecule 1; PET, position emission tomography, TTC, triphenyltetrazolium chloride.

