Figure 3.
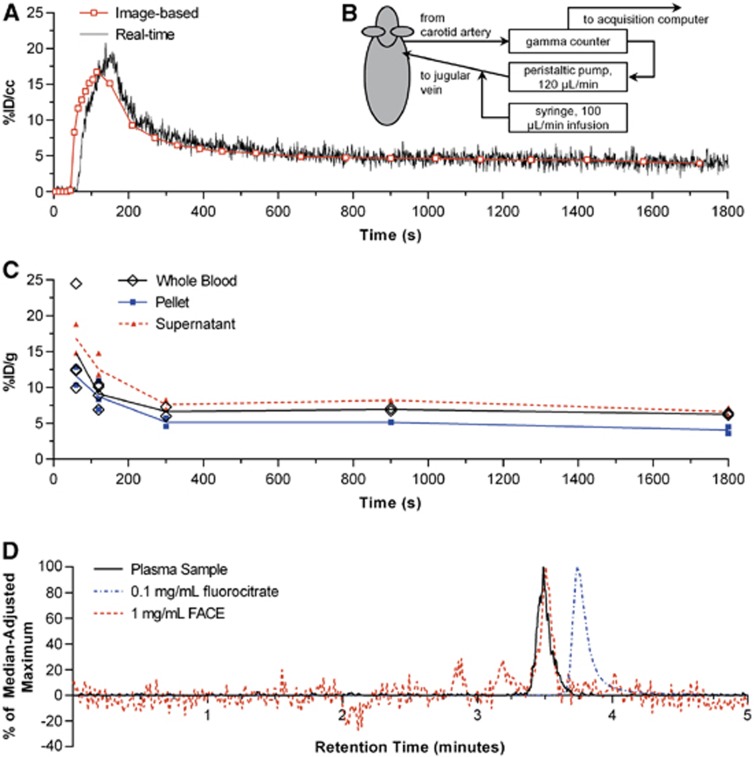
Results from different whole blood measurement techniques. (A) Example comparison of [18F]fluoroacetate ([18F]FACE) whole blood curves derived from real-time sampling (B) and concurrent imaging. (C) Manually sampled whole blood with plasma and red/white blood cell fractions denoted as ‘supernatant' and ‘pellet', respectively. (D) Chromatograms of: plasma samples from animals (n=2, 1 replicate each) 30 minutes post [18F]FACE injection; 0.1 mg/mL fluorocitrate standard; 1 mg/mL FACE standard. Signal from plasma samples are represented as percent of the median-adjusted maximum analog-to-digital converter signal from the 0–5 minute retention times. Chromatograms of fluorocitrate and FACE standards are represented as percent of median-adjusted maximum extracted ion count between the 0 to 5 minutes retention times.

