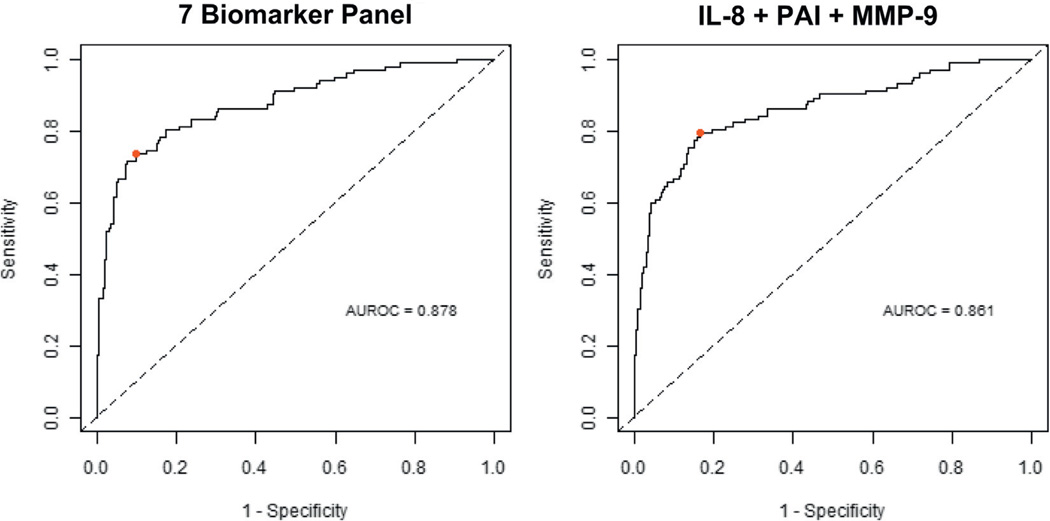
Figure 2.
Diagnostic performance of urine biomarker combinations. ROC curves were plotted to compare diagnostic performance of 7 and 3 (IL-8, PAI-1 and MMP-9) biomarker signatures. Based on AUROC, Youden Index cutoffs (red circle) that maximized sum of sensitivity and specificity were determined for each combination.

