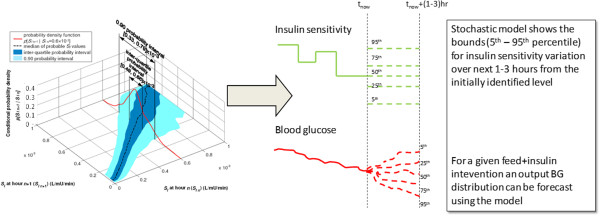
Figure 1.

Schematic of the stochastic model showing the percentiles (5th - 95th) for insulin sensitivity variation for the forthcoming 1–3 hours (n + 1). For a feed and insulin intervention an output BG distribution can be forecast using the physiological glucose – insulin model.
