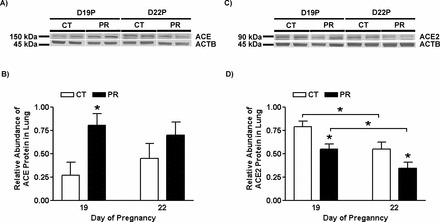
FIG. 2.

Western blotting analysis of ACE and ACE2 proteins in lungs from pregnant rats with PR at Days 19 and 22 of pregnancy. A) ACE proteins shown as 150-kDa bands. B) Relative abundance of ACE protein. C) ACE2 proteins shown as 90-kDa bands. D) Relative abundance of ACE2 protein. ACTB, beta-actin; CT, control; PR, protein restriction. The error bar represents the mean ± SEM expressed as the ratio of density of the ACE or ACE2 band to that of ACTB (n = 4–5). *P < 0.05.
