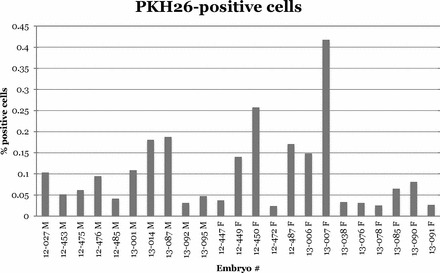
FIG. 2.

There was a considerable difference in the quantity of donor-derived cells within stages 35–38 host gonads. This graph shows the individual variation expressed as percent of positive cells per gonad (testes or left ovary), minus the average background from uninjected control embryos. Host gonads were considered to be donor cell positive if the percent of positive cells was greater than the average control plus two standard deviations for each experiment.
