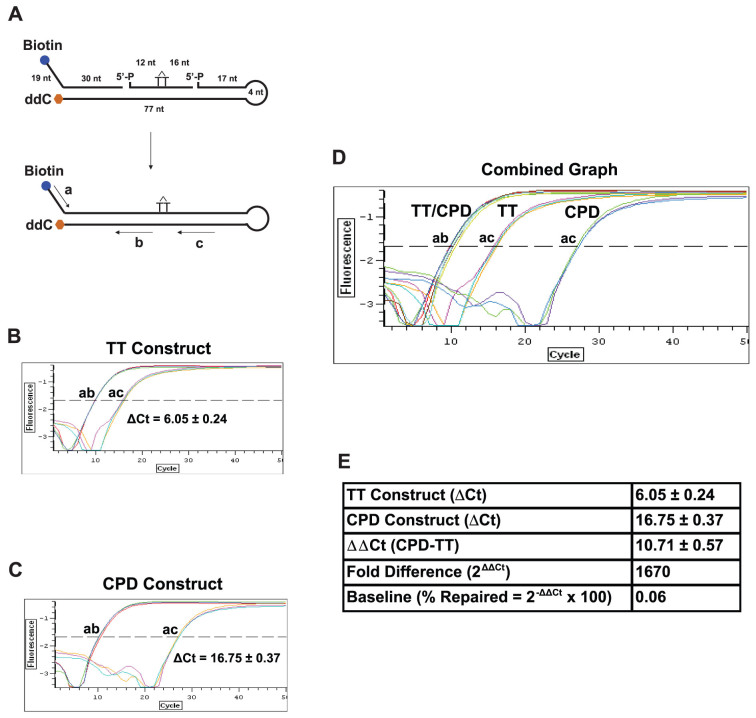
Figure 2. Design of ORA oligonucleotide construct for NER.
(A) Construction of the ORA oligonucleotide that contains a CPD lesion. The 30-nt synthetic ssDNA fragment containing a CPD lesion (marked as a T-T dimer) was hybridized with a 5′-biotinylated (49 nt) and a 3′-ddC protected (98 nt) fragment to form a hairpin dsDNA construct after ligation. The resulting construct contains a central 77-bp dsDNA region with a 19-nt ssDNA in the 5′-terminal region and a 4-nt hairpin at the end of the 3′ arm. The CPD residue locates approximately at the center of the dsDNA stretch, 33 bp from the 3′ end and 42 bp from the 5′ end of the dsDNA region. Including the 19-nt ssDNA sequence, the 5′ arm of the CPD-containing construct is 61 nt/bp in length. Primers for qPCR quantification are shown in arrow lines, where amplification by primers a/b represents the total amount of the oligonucleotide and by a/c the amount of the repaired oligonucleotides. The percentages of oligonucleotide repaired were calculated by the following equation: % Repaired = (2−ΔCt) × 100, ΔCt = Ct Control (a/b) − Ct Test (a/c). (B–E) Calibration of CPD-containing oligonucleotide constructs. qPCR was carried out using 1 μl of 5 nM ligated normal TT- (B) or CPD-containing construct (C) as template. PCR amplifications with primers a and b serve as the internal control for the total number of substrate molecules, whereas amplifications with primers a and c quantify the amount of the repaired products. Based on the ΔCt value (ac-ab) of the TT construct, the ligation efficiency (% ligation = 1/2ΔCt × 100) was 1.5% (B). Since CPD adducts block the activity of Taq polymerase (C), the ΔCt value (ac-ab) of the CPD construct is greater than that of the normal TT control (D), yielding a ΔΔCt value (CPD-TT) of 10.71 that converts to a 1,670-fold blockage by CPD (Fold Difference = 2ΔΔCt) (E). Using this 2ΔΔCt method, we were able to obtain differential repair efficiencies of the CPD construct in cells with altered genetic backgrounds. Data are presented as mean ± S.D. from three independent experiments.

