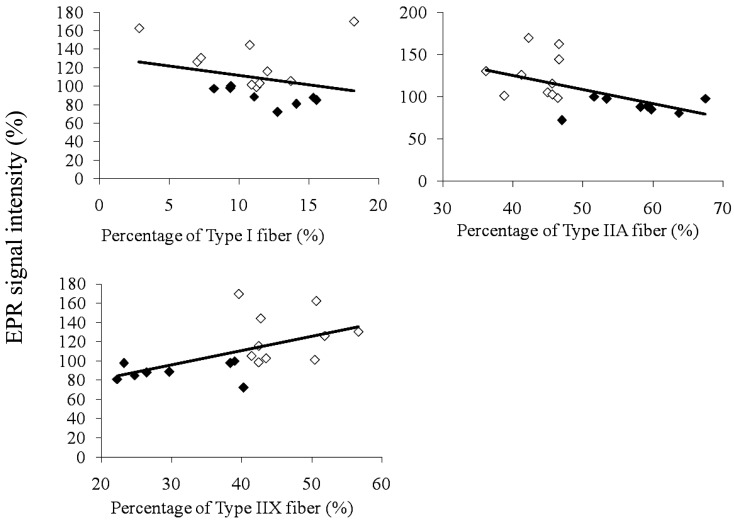
Fig. 4.
Correlations between percentages of each muscle fiber type and change rates in EPR signal intensity at 1 min after exercise. Change rates at 1 min after the exercise test are expressed relative to the pre-value. Percentages of each muscle fiber type are expressed as the ratio to all muscle fibers. ◇: Pre-training, ◆: Post-training.

