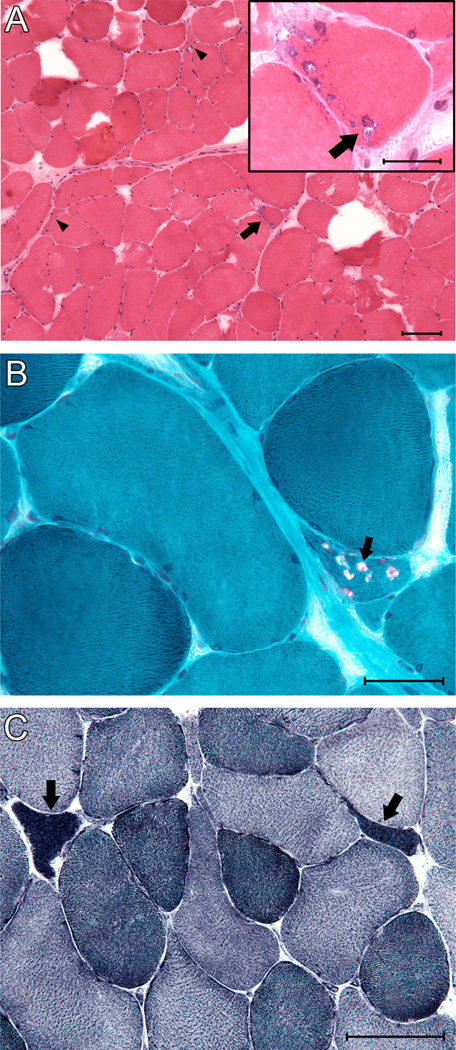
Figure 2.
Histopathological examination of LGMD1D muscle biopsy. (A) Low magnification photomicrograph of hematoxylin and eosin stained cryosection of biceps muscle biopsy, showing marked variation in fiber sizes, and a fiber with several rimmed vacuoles (arrow), highlighted in modified Gomori trichrome stain (inset, arrow), and scattered angular atrophic fibers (arrowheads). Hematoxylin and eosin, scale bar = 100 microns. Inset: High magnification view of region indicated by arrow, scale bar = 25 microns. (B) High magnification view of biceps muscle biopsy cryosection showing moderate variation in fiber size, a minimal increase in endomysial connective tissue, and a fiber containing numerous rimmed vacuoles (arrow). Modified Gomori trichrome, scale bar = 50 microns. (C) Higher power photomicrograph showing overly dark angular atrophic fibers typical of neurogenic atrophy (arrows). NADH enzyme histochemistry, scale bar = 100 microns.

