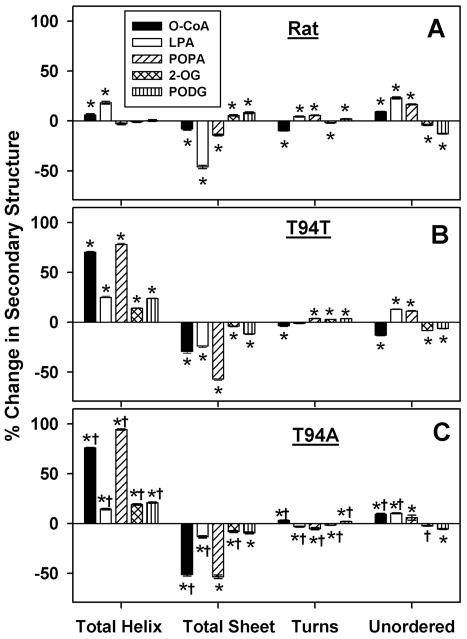
Figure 8. Changes in secondary structure of rat and human L-FABP upon interaction with O-CoA, LPA, POPA, 2-OMG or PODG.
L-FABP (0.5 μM) was examined by CD spectroscopy and subsequent secondary structure analysis in the absence or presence of 5 μM ligand as described in Experimental Procedures. The data were presented as % change in secondary structure (L-FABP/ligand – L-FABP only) of rat (panel A), T94T (panel B), and T94A (panel C) L-FABP upon interaction with Oleoyl CoA (black bar), LPA (white bar), POPA (hatched bar), and 2-OMG (cross hatched bar), and PODG (vertical hatched bar). *, P < 0.05 for L-FABP/ligand secondary structure vs. L-FABP only secondary structure; †, P < 0.05 for T94A/ligand secondary structure vs. T94T/ligand secondary structure.

