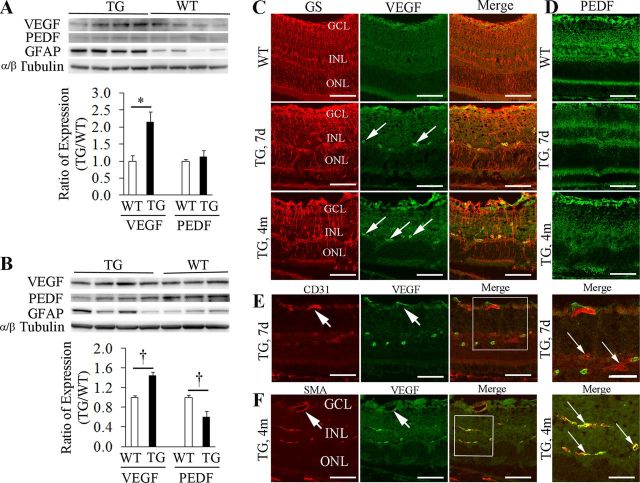
Figure 9.
Imbalanced expression of VEGF-A and PEDF after Müller cell ablation. A, Western blot showed upregulation of VEGF-A while the expression of PEDF remained relatively unchanged 7 d after Müller cell ablation. *p < 0.01, TG versus WT, n = 8 in each group. B, By 4 months after Müller cell ablation, Western blot revealed significant upregulation of VEGF-A and downregulation of PEDF. †p < 0.05, TG versus WT controls, n = 7–8 in each group. TG mice showed persistent upregulation of GFAP 7 days and 4 months after Müller cell ablation, indicating that the survival Müller cells were at a stage of reactive gliosis. C, Double-label IHC revealed that VEGF-A was weakly expressed in the superficial retina in WT but strong immunoreactivity was detected around deep retinal vessels (arrows) in TG retinas 7 d and 4 months after Müller cell ablation. D, Reduced expression of PEDF in areas of Müller cell ablation. E, F, Double-label IHC using CD31 for the vascular endothelium and SMA for pericytes in combination and antibody to VEGF-A suggested that overexpression of VEGF-A was more likely from pericytes (F, small arrows) than from the vascular endothelium (E, small arrows). Note: the superficial retinal vessels did not overexpress VEGF-A (large arrows in E and F). GS, glutamine synthetase; GCL, ganglion cell layer; INL, inner nuclear layer; ONL, outer nuclear layer. Scale bars: C–F, 50 μm; the squared area in E, 30 μm; the squared area in F, 20 μm.

