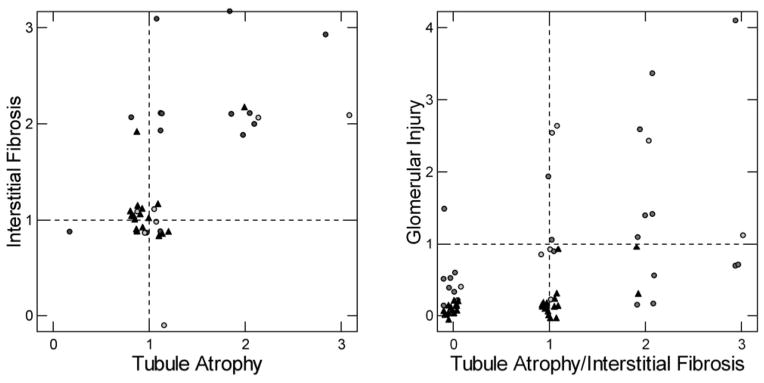
Figure 10. Cortical Interstitial fibrosis and tubular atrophy of brushite (black circles), apatite (open circles) and ICSF (black triangles).

Left panel. A majority of interstitial fibrosis or tubular atrophy scores of 2 or more, denoting significant disease, are in BRSF (statistics in RESULTS). Values <1 are omitted for visual clarity. Points are randomly jittered to permit counting; without this they would overlap at the ordinal intersects. Right panel. The highest of interstitial or tubular atrophy score is plotted on the x-axis. On the y axis is plotted the glomerular injury score (METHODS) which sums up the average of mild, moderate and severe changes in sampled glomeruli. The score is calculates so that values above 2 reflect either multiple glomeruli with moderate sclerosis or that glomeruli with mild or absent sclerosis be balanced by some with global sclerosis.
