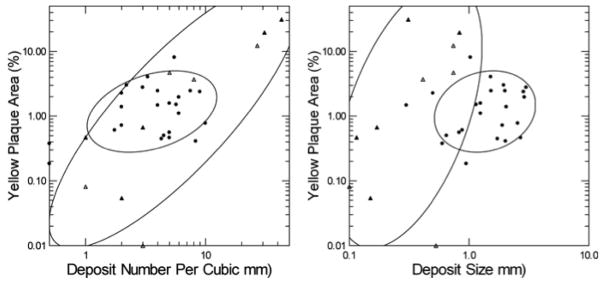
Figure 8. Relationship of yellow plaque to numbers and sizes of intra-tubular deposits.

Abundance of yellow plaque (Vertical axes of both panels) varies with numbers of deposits (Left panel) in HASF (triangles) but not BRSF (Circles) and the range of yellow plaque in HASF far exceeds that of BRSF. Yellow plaque does not vary significantly with deposit size (Right panel) in either group. Filled triangles denote patients with NIPS.
