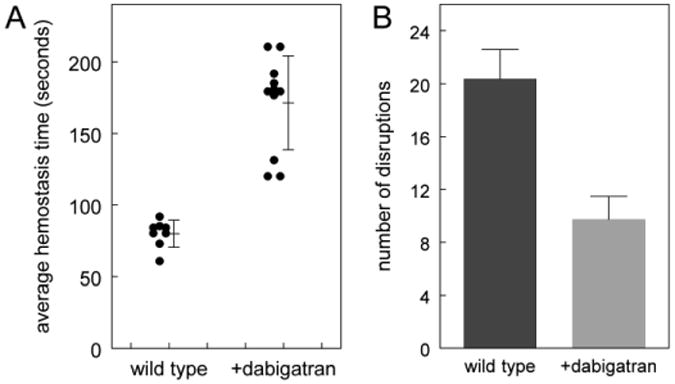
Figure 1.

Effect of dabigatran on a saphenous vein bleeding model. A. Bleeding over 30 minutes was measured by disruption of hemostatic clots as described in Methods. Average hemostasis times for wild type C57BL6/J mice (n=8) and C57BL6/J mice injected with 15 μg/kg dabigatran (n=11) are plotted; each dot represents an animal. The mean and standard deviation are shown. Wild type differs from dabigatran treated (p<0.001). B. The data in Figure 1A can be expressed as the number of disruptions in 30 minutes; the error bar shows the standard deviation. Wild type differs from dabigatran treated (p<0.001).
