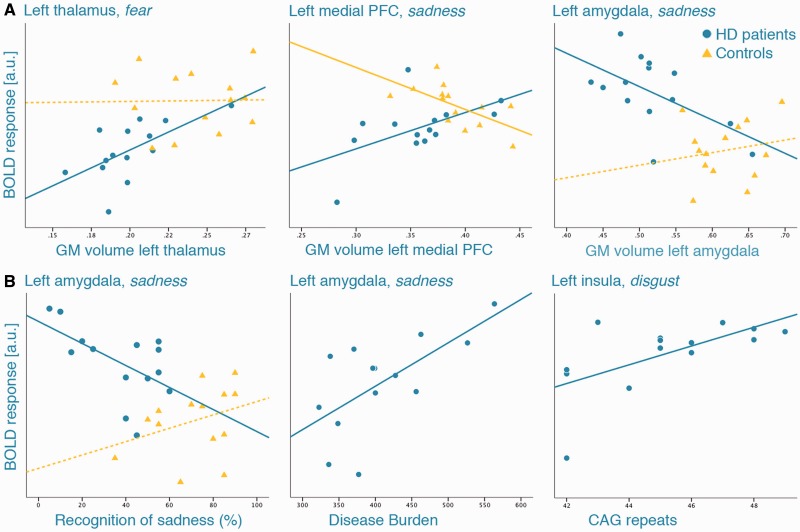
Fig. 3.
Scatter plots demonstrating the associations between functional activity in significant ROI and (A) regional volume loss in the same region; (B) behavioral task performance and genetic variables. Circles represent HD patients, triangles healthy controls; continuous lines indicate significant Pearson’s r at P < 0.05, dotted lines non-significant correlations. PFC, prefrontal cortex; a.u., arbitrary units; GM, gray matter.

