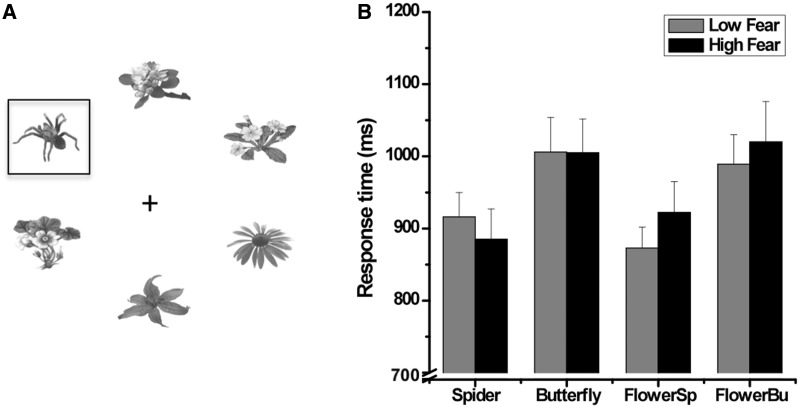
Fig. 1.
(A) Sample of a search array used in the present study. The square marks the target (spider) among various distractors (flowers). (B) Response times for all target conditions [spider targets, butterfly targets, flower targets among spider distractors (FlowerSp) and flower targets among butterfly distractors (FlowerBu)] as a function of group (high fearful vs low fearful). Error bars represent standard error of the means (SEM).

