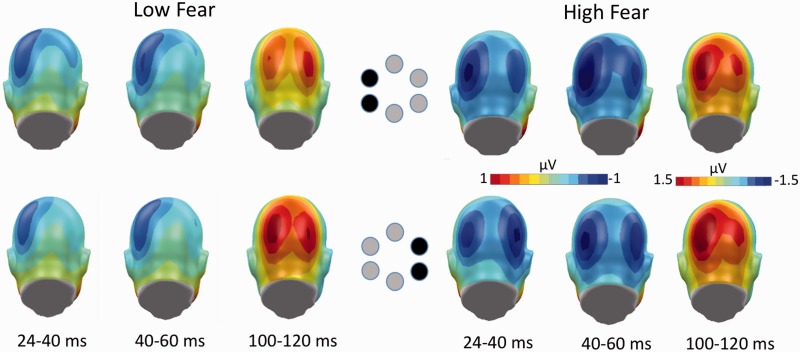
Fig. 3.
Illustration of the topographical voltage maps (back views) for all target objects, showing the distribution of C1 negativity in the time interval from 24 to 40 ms and from 40 to 60 ms for control (left) and spider-fearful subjects (right). In addition, P100 topographical maps are shown for both experimental groups for the 100–120 ms time window. Upper panel represents the topography for targets presented in the left visual field, whereas the lower panel represents the neural activity in response to targets presented in the right visual field.

