
Fig. 3.
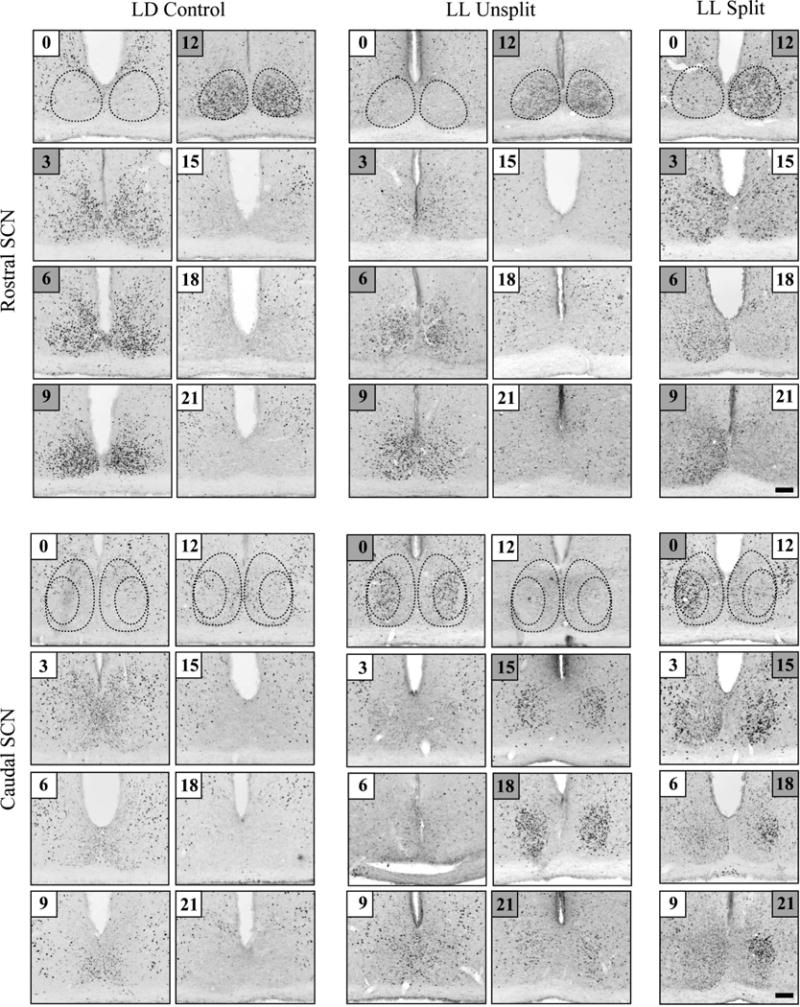
FOS expression in the rostral (top) and caudal SCN (bottom) in three groups. Dotted lines delineate the SCN shell rostrally, and the core and shell caudally, on the basis of AVP immunoreactivity. The time sampled (zeitgeber or circadian) is boxed in each image. Time points with high FOS expression are indicated by gray shading (3–12 in the rostral SCN shell in LD and LL unsplit hamsters, and 15–0 in the core of LL unsplit hamsters). Times were assigned to the split SCN by matching the high-expression and low-expression sides to the corresponding high and low time points in the unsplit control animals. Scale bar: 100 μm.