
Fig. 4.
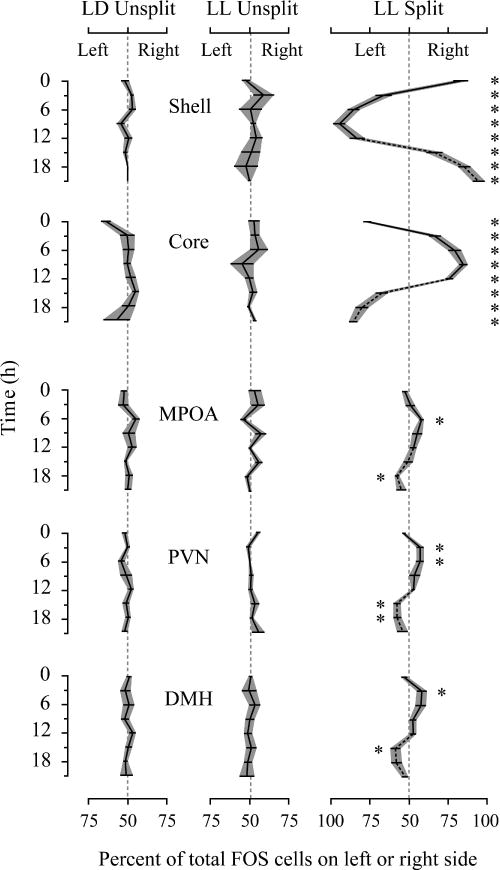
Lateralization. Each panel shows the extent to which FOS is expressed preferentially on the left or right sides of the brain. Gray shading indicates standard error. On the x-axis, 50% designates equal numbers on the left and right sides of the brain, and deviations left and right indicate laterality to the left or right (100% represents all FOS cells on one side). *Paired t-test, P < 0.05 for left vs. right, calculated after repeated measures ANOVA revealed a significant main effect of hemisphere. For LL split hamsters, the reciprocal data are plotted for CT12–CT21 for better visualization. When fewer than five FOS-positive cells were detected in a region for a particular hamster, its laterality score was set to 50%. LD unsplit, n = 32, LL unsplit, n = 31 (3–5/time point). Split, n = 24 (5–7/time point).