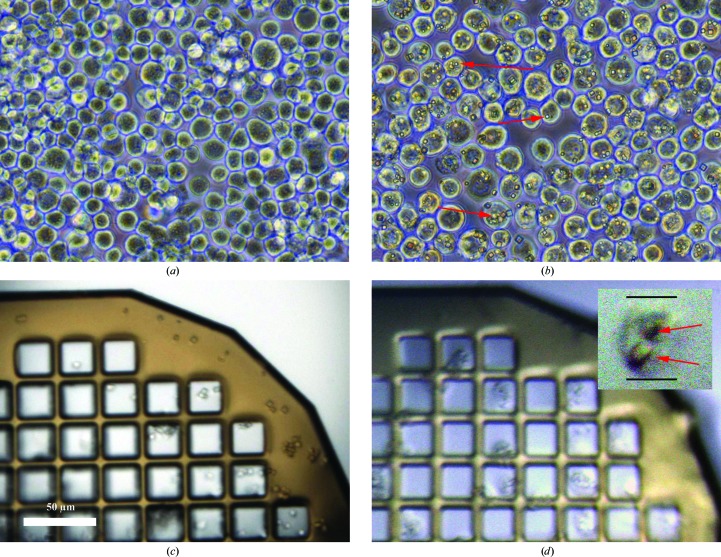
Figure 1.
(a) Uninfected cells. (b) Infected cells. (c) Isolated crystals loaded onto a 25 µm mesh, pictured with an on-axis sample view on the beamline during data collection. (d) Infected cells loaded onto a 25 µm mesh, pictured with an on-axis sample view on the beamline during data collection; the inset shows a close-up of a single cell with two crystals visible. All panels are shown on the same scale. Red arrows indicate polyhedra crystals.

