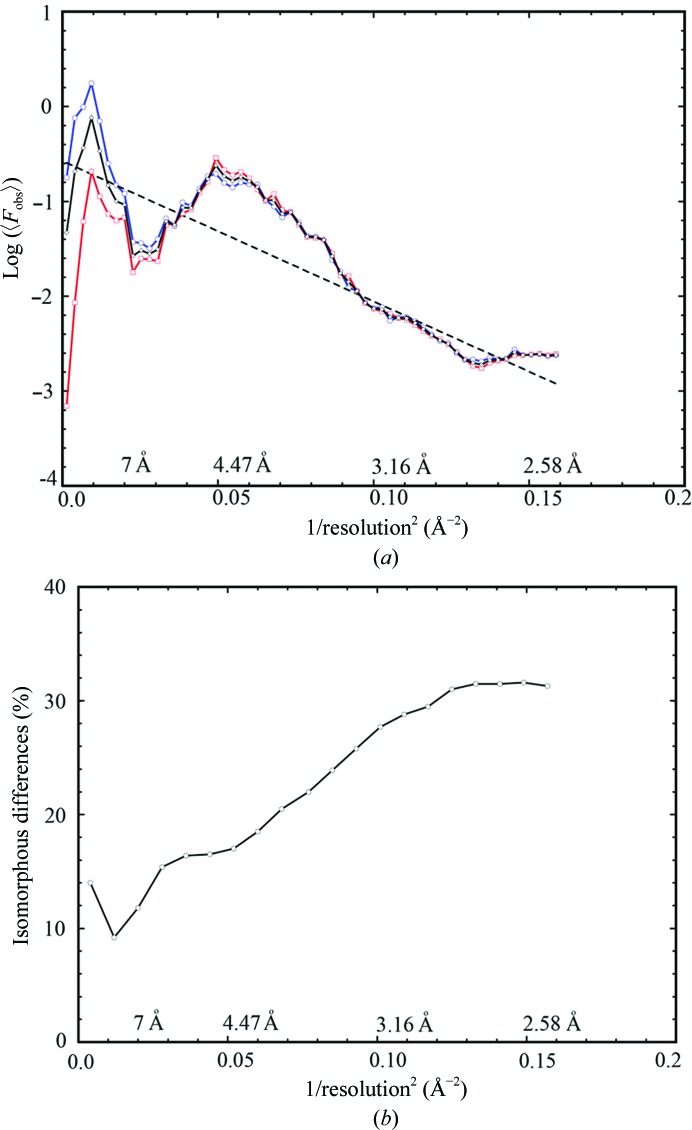
Figure 2.
Wilson plots and quality of the experimental data. (a) Wilson plots for reflections with (h + k + l = 2n) in blue, reflections with (h + k + l = 2n + 1) in red and all reflections in black. Linear fitting (dotted line) for three sectors of data resulted in a single line. (b) Isomorphous differences between the two data sets processed from two different crystals as a function of reciprocal resolution squared.

