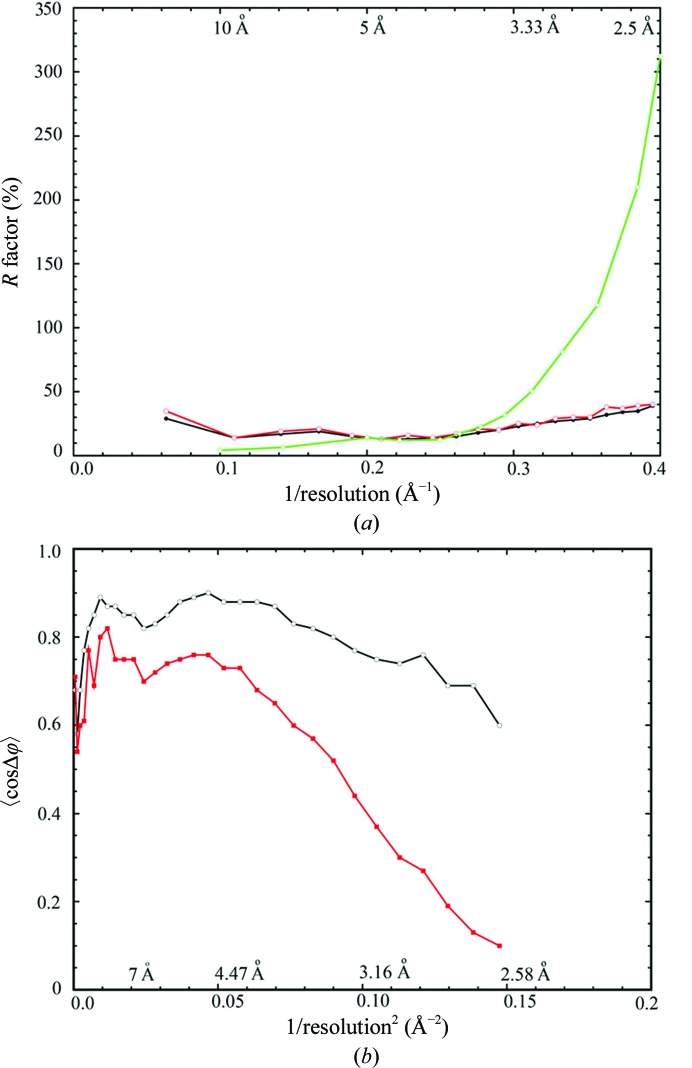
Figure 4.
Refinement and data-processing statistics. (a) Plots of crystallographic working (black) and free (red) R factor on amplitude as well as merging R factor (green, on intensity) as a function of reciprocal resolution. (b) Plots of average cosine of phase-angle differences between NCS-averaging-derived experimental and model-derived phases (red) as well as the cosine values of the estimated phase errors from differences (black) between observed and calculated amplitudes as a function of reciprocal resolution squared.

