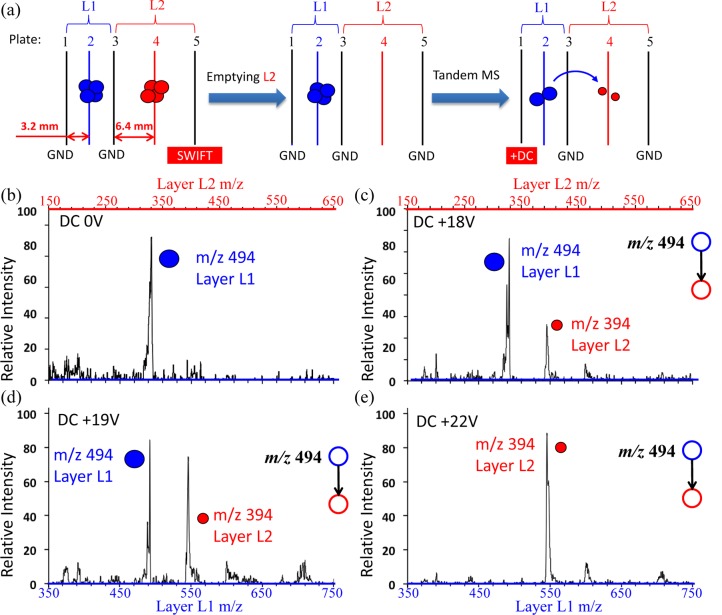
Figure 5.
(a) Schematic illustration of the tandem-in-space procedure for an ion sponge with two trap layers of different sizes. (b–e) Mass spectra recorded for CID of protonated imatinib m/z 494 using an ion sponge with L1 of Geometry IV and L2 of Geometry V, at activation DC voltage of (b) 0 V, (c) +18 V, (d) +19 V, and (e) +22 V DC, respectively.

