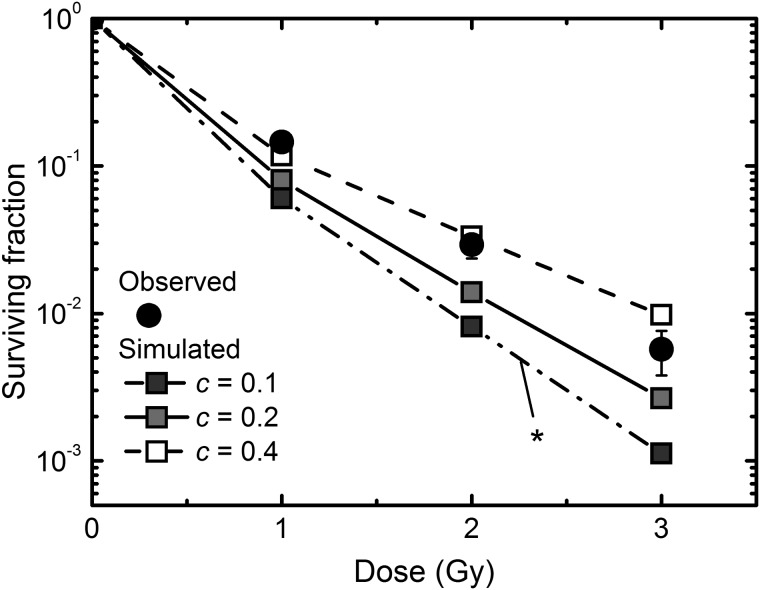
Figure 6:
Surviving fraction estimated from the simulated abortive colony formation. Solid circles demonstrate the experimentally determined surviving fraction, and lines with squares represent the simulated surviving fraction with the specific slope c = 0.1, 0.2 or 0.4 using the parameters obtained from the log–log fit. Error bars represent standard errors of the mean for the solid circles. An asterisk indicates a significant difference (P < 0.05) between observed and simulated dose–response curves tested by the chi-squared test with the Bonferroni correction.

