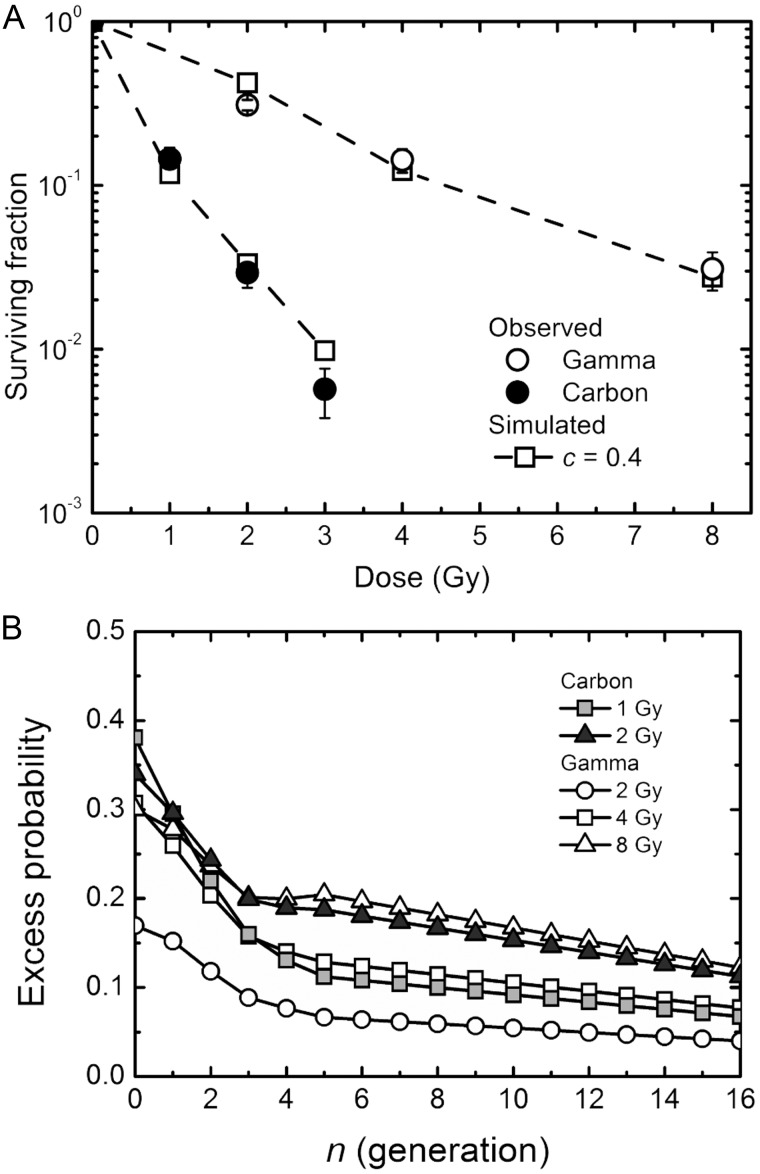
Figure 7:
Comparison between low-LET γ-rays and high-LET carbon ions. (A) The observed surviving fraction (circles) and simulated one (squares). The data for γ-irradiation were taken from the previous report [7]. Circles indicate the experimentally determined surviving fraction, and lines with squares indicate the simulated surviving fraction with the specific slope c of 0.4 using the parameters obtained from the log–log fit. Error bars represent standard errors of the mean. (B) The excess reproductive cell death (RCD) probability. The data for 1 and 2 Gy of carbon ions and 2, 4 and 8 Gy of γ-rays were plotted.

