. 2013 Dec 17;55(3):451–454. doi: 10.1093/jrr/rrt138
© The Author 2013. Published by Oxford University Press on behalf of The Japan Radiation Research Society and Japanese Society for Radiation Oncology.
This is an Open Access article distributed under the terms of the Creative Commons Attribution License (http://creativecommons.org/licenses/by/3.0/), which permits unrestricted reuse, distribution, and reproduction in any medium, provided the original work is properly cited.
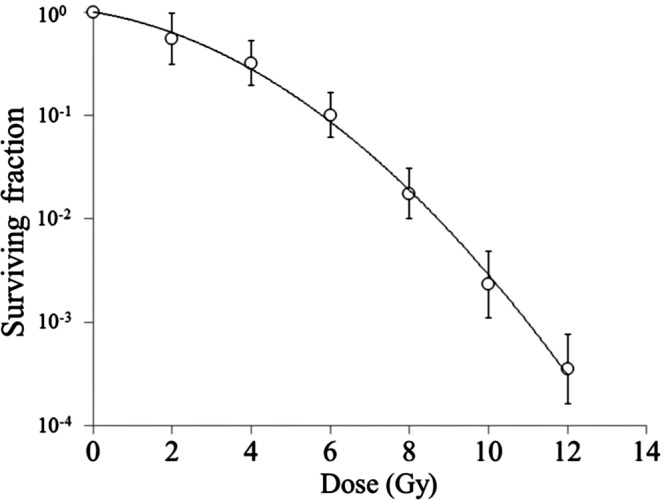
Fig. 1.

Dose–survival curve for EMT6 single cells. Bars represent standard deviation.
