
Figure 3.
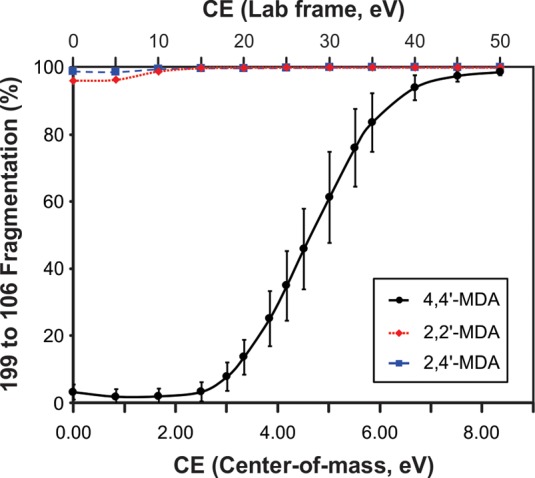
Collision-induced dissociation curves monitoring the transition of respective 199 Da parent ions to 106 Da fragment ions. Individual curves for 4,4′-MDA (solid line; black circles), 2,2′-MDA (short dash; red squares), and 2,4′-MDA (long dash; blue triangles) are superimposed. Both center-of-mass and lab-frame collision energies are shown.