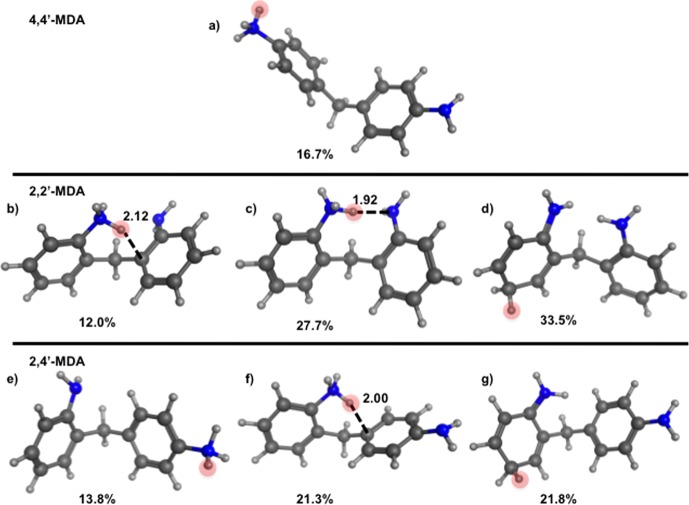
Figure 6.
RMSD clustering representatives from computational conformational sampling are shown for each of the protonation sites. (a) 4,4′-MDA p-NH2 protonated, (b) 2,2′-MDA o-NH2 protonated, (c) 2,2′-MDA o-NH2 protonated, (d) 2,2′-MDA ring protonated, (e) 2,4′-MDA p-NH2 protonated, (f) 2,4′-MDA o-NH2 protonated, and (g) 2,4′-MDA ring protonated. Red circles indicate the additional proton. Labeled bond distances are used to show the proximity of the additional proton to the bridging carbon that would lead to a 1,5-hydrogen shift fragmentation of the 2-ring MDA. A percentage is shown below each conformation to show how many conformations the selected one represents, as a result of RMSD clustering. Two conformations are shown for the 2,2-MDA o-NH2 protonated 2-ring MDA due to two favorable conformations that result from this protonation.

