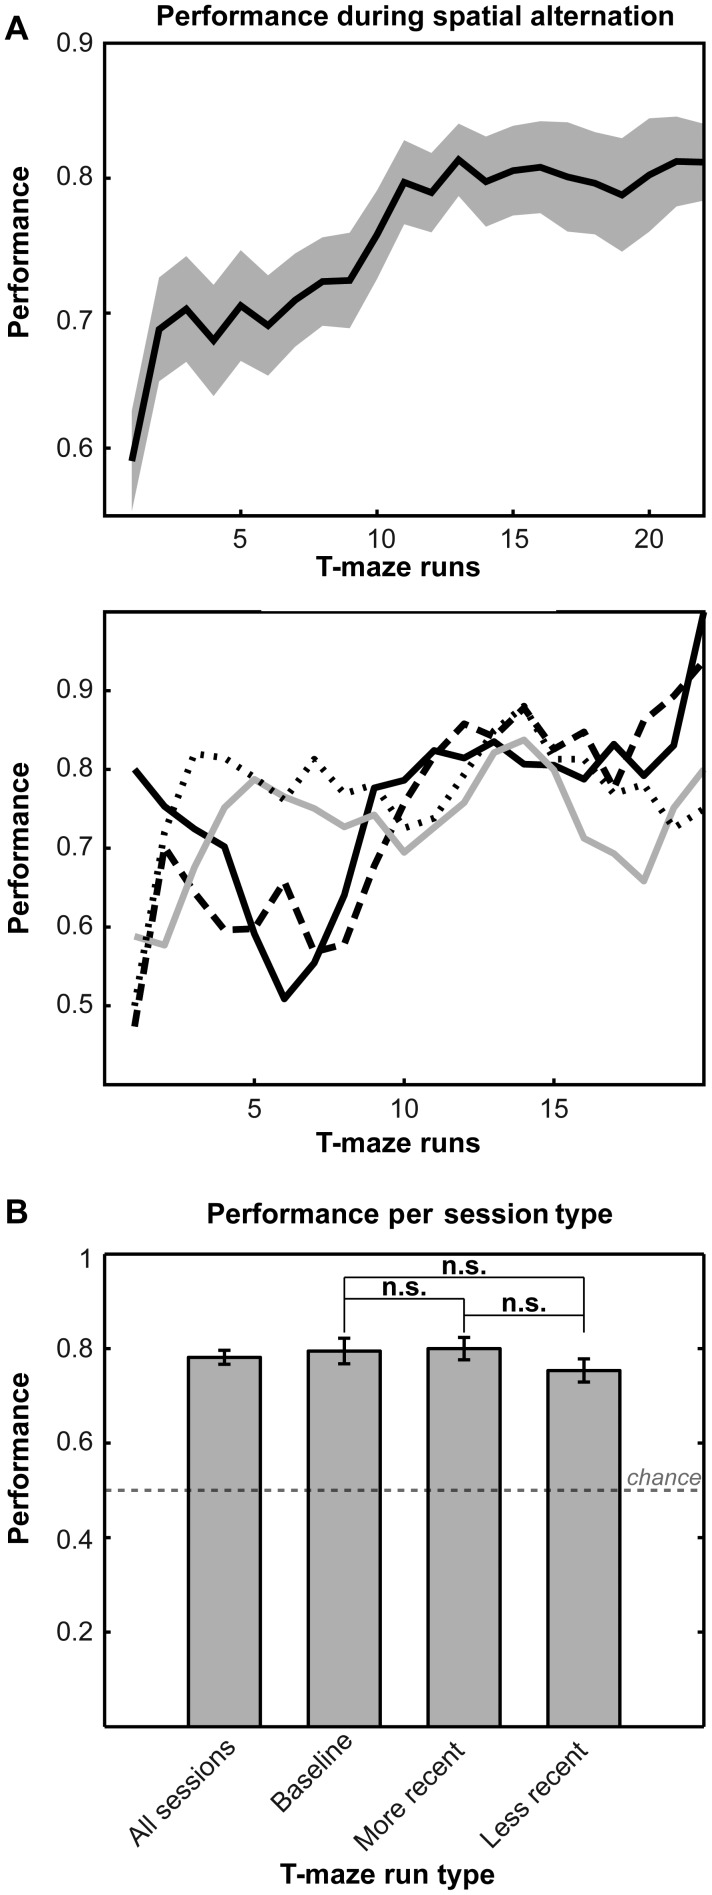
Figure 2.
Performance. (A) Top: Mean performance displayed for all 4 animals showing improvement from 59% to 83% across T-maze runs. Bottom: Individual performance across 20 T-maze runs for rats AC (black), P3 (long black dash), P5 (gray), and P9 (short black dash). (B) Performance does not vary significantly by T-maze run type [(baseline − more recent, P = 0.89); (baseline − less recent, P = 0.48), (more recent − less recent, P = 0.48), 2-sample t-tests with Holm–Bonferroni correction]. Note that more recent (experienced within the last 7 days) and less recent rotations (experienced beyond the last 7 days) are meant to occur on the same testing day in pseudorandomized order (Fig. 1).

