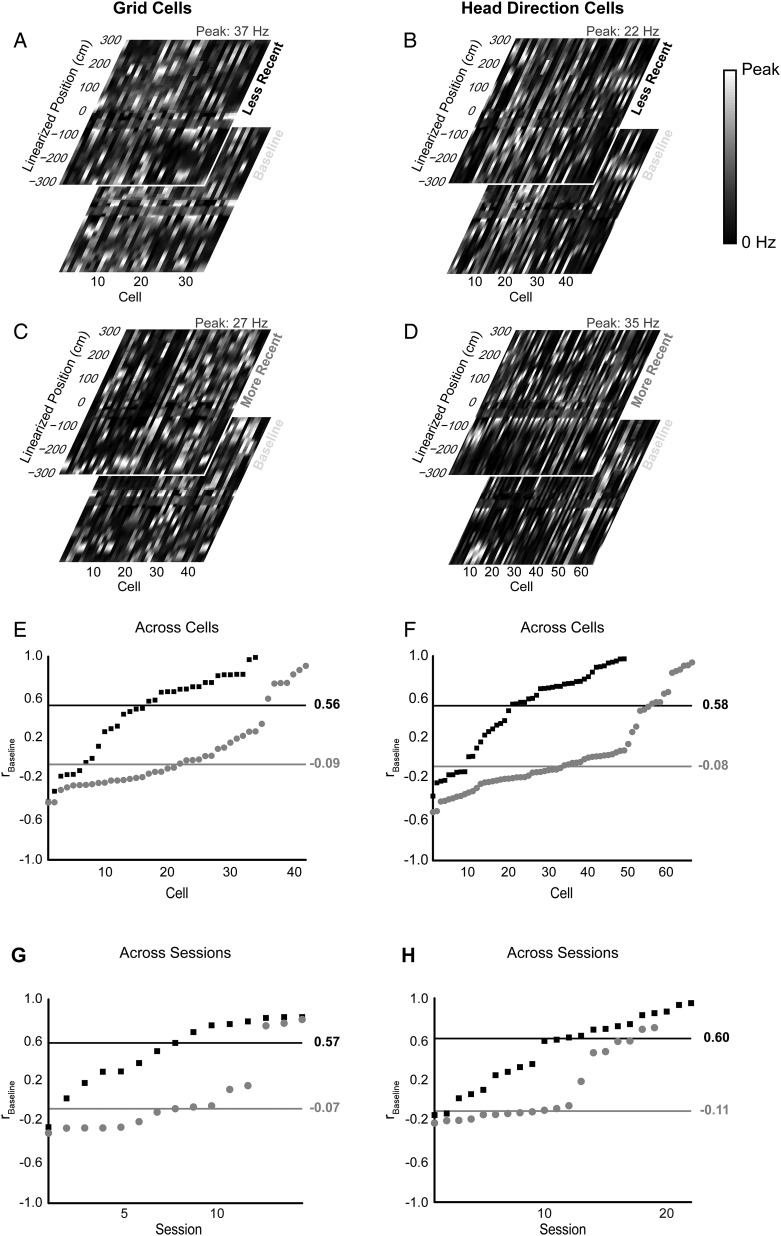
Figure 5.
Linearized rate map correlations for grid and HD cells. Population vectors of linearized rate maps for conditional (less recent and more recent) and baseline T-maze sessions are shown for (A and C) grid cells and (B and D) HD cells. Correlation coefficients between baseline and conditional T-maze sessions, rbaseline, for (E) grid cells and (F) HD cells show significantly higher correlations for the less recent orientation (black rectangles) versus the more recent (gray dots) orientation across all cells (grid cells: P = 3.7 × 10⁻⁵, KS-Statistic = 0.521; HD cells: P = 2.5 × 10⁻⁷, with KS-Statistic = 0.518; 2-sample KS test). Black and gray horizontal lines indicate a median rbaseline value for less recent and more recent distributions, respectively. Similar profiles are seen when looking at distributions of mean correlations across sessions of simultaneously recorded (G) grid cells and (H) HD cells (grid cells: P = 0.0011, KS-Statistic = 0.667; HD cells: P = 0.0015; KS-Statistic = 0.576; 2-sample KS test). Data ordered by value of rbaseline.

