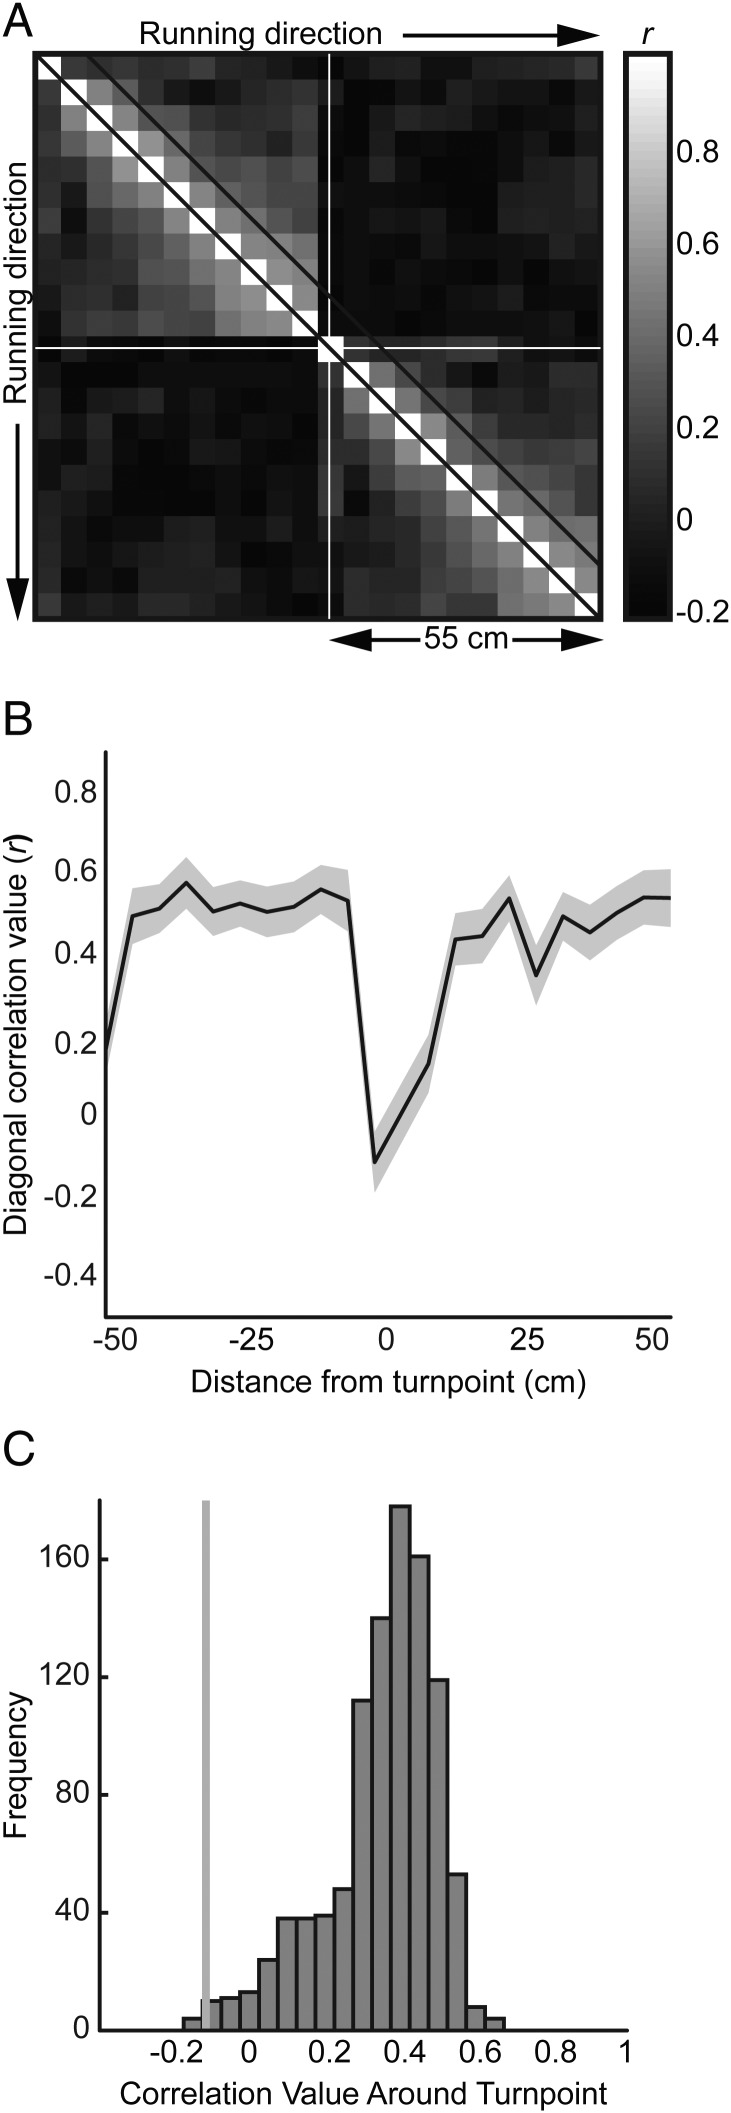
Figure 8.
Turning point analysis. (A) Spatial correlation matrix of firing rate population vectors centered at the turning point (white cross-hairs) in 5 cm bins, 55 cm around the turning point across all grid cells. Diagonal lines represent boundaries of first adjacent bin to each linear position. This diagonal is plotted in (B) with standard error of the mean (SEM) shaded in gray and minimal correlation just before 0 cm (the turning point). (C) Monte Carlo distribution of 1000 correlation coefficients between a trigger point (randomly chosen to within 40 cm of an actual maze turning point) and its adjacent bin. The gray line shows the minimum correlation (r = −0.12) with P < 0.007 with respect to the distribution.

