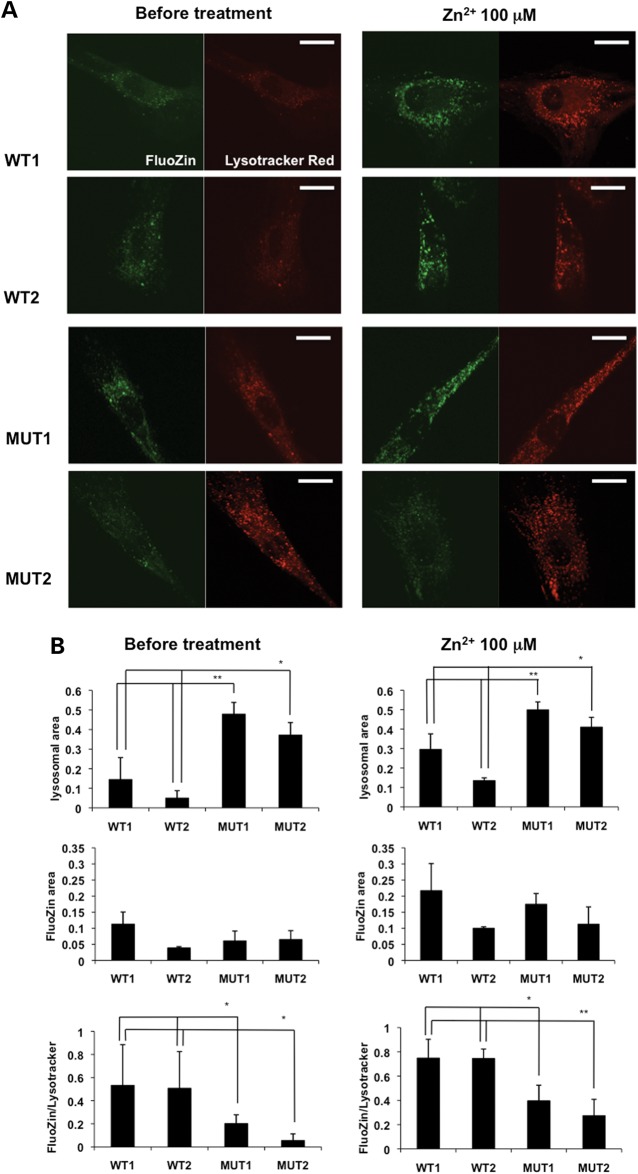
Figure 2.
PARK9 mutation alters Zn2+ distribution in fibroblasts. (A) The representative confocal live-cell images of fibroblasts stained with FluoZin-3 (green) and LysoTracker Red (red). Two wild-type (WT1 and WT2) and two PARK9 mutant (MUT1 and MUT2) fibroblast lines were stained before (left) or after treatment with 100 μm Zn2+ for 1 h (right). Scale bars indicate 20 μm. (B) Quantification analysis of LysoTracker Red and FluoZin-3 area per total cell area before (left) and after Zn2+ incubation (right). Left, upper, quantification analysis of LysoTracker Red-positive area per total cell area (n = 10, *P < 0.01, **P < 0.001). Middle, quantification of FluoZin-3-positive area per total cell area (n = 10, *P < 0.005). Bottom, quantification of FluoZin-3-positive area per LysoTracker Red-positive area (n = 10, *P < 0.05). Right, upper, quantification of LysoTracker Red-positive area per total cell area (n = 10, *P < 0.05, **P < 0.03). Middle, quantification of FluoZin-3-positive area per total cell area. Bottom, quantification analysis of FluoZin-3-positive area per LysoTracker Red-positive area (n = 10, *P < 0.03, **P < 0.005). The values are the mean ± SEM.

