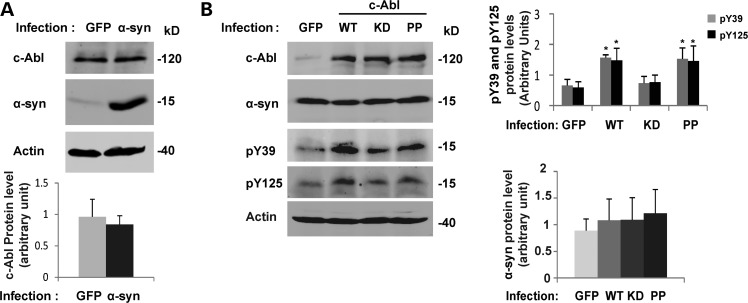
Figure 9.
α-syn protein level does not increase in cortical neurons infected by c-Abl. (A) Cortical neurons were infected with lentiviruses for GFP or α-syn (top panel). After 5 days, neurons were lysed in Laemmli buffer 2× and the proteins were separated using SDS–PAGE. The expression levels of α-syn and c-Abl were assessed by WB. Actin was used as a loading control. c-Abl protein level was evaluated by densitometry quantification (bottom panel). The band intensities were normalized in the following manner: (c-Abl/actin). The bars represent the mean ± SD of three independent experiments. P > 0.05 (Student's t-test: GFP versus α-syn infected cells). (B) Cortical neurons were infected with lentiviruses for GFP, WT, KD or PP c-Abl. After 5 days, cells were lysed in Laemmli buffer 2× and the proteins were separated by SDS–PAGE. α-syn and c-Abl expression levels were assessed by WB (left hand panel). α-syn phosphorylation status was also confirmed using anti-pY39 or pY125 antibodies in a separate protein blot. Actin was used as a loading control. The α-syn protein levels were evaluated by densitometry quantification (right-hand-side panels). The band intensities were normalized in the following manner: (α-syn/actin). The bars represent the mean ± SD of three independent experiments. P > 0.05 (Student's t-test:GFP versus c-Abl infected cells); *P < 0.05 (Student's t-test: GFP versus WT or PP c-Abl infected cells).

