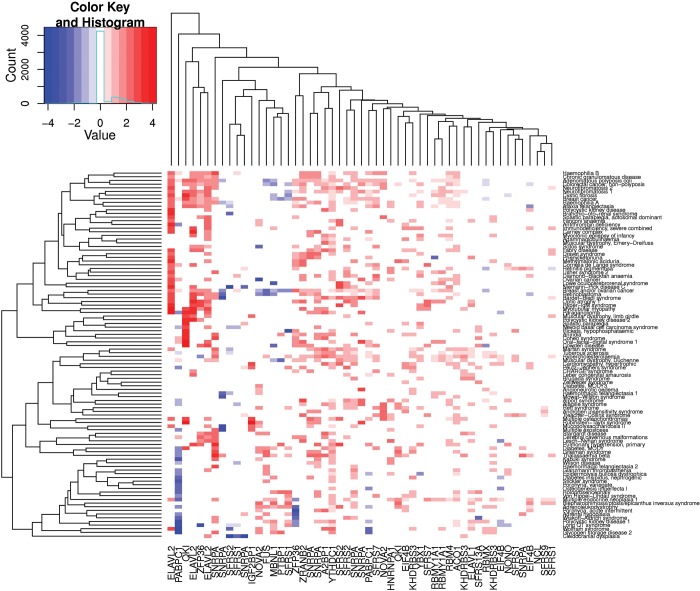
Figure 2.
Heat map of the relative proportion of INDELs that change RBP binding between disease-causing INDELs and neutral INDELs. Each dot, corresponding to one disease–RBP pair, represents the log2-transformed ratio of the proportion of disease-causing INDELs that change RBP-binding affinity, and the proportion of neutral INDELs. Only significant (P < 0.05) disease–RBP pairs are plotted. Red dots indicate significantly higher proportions of disease-causing INDELs potentially changing RBP binding than neutral INDELs, and blue dots indicate lower proportions.

