Figure 2.
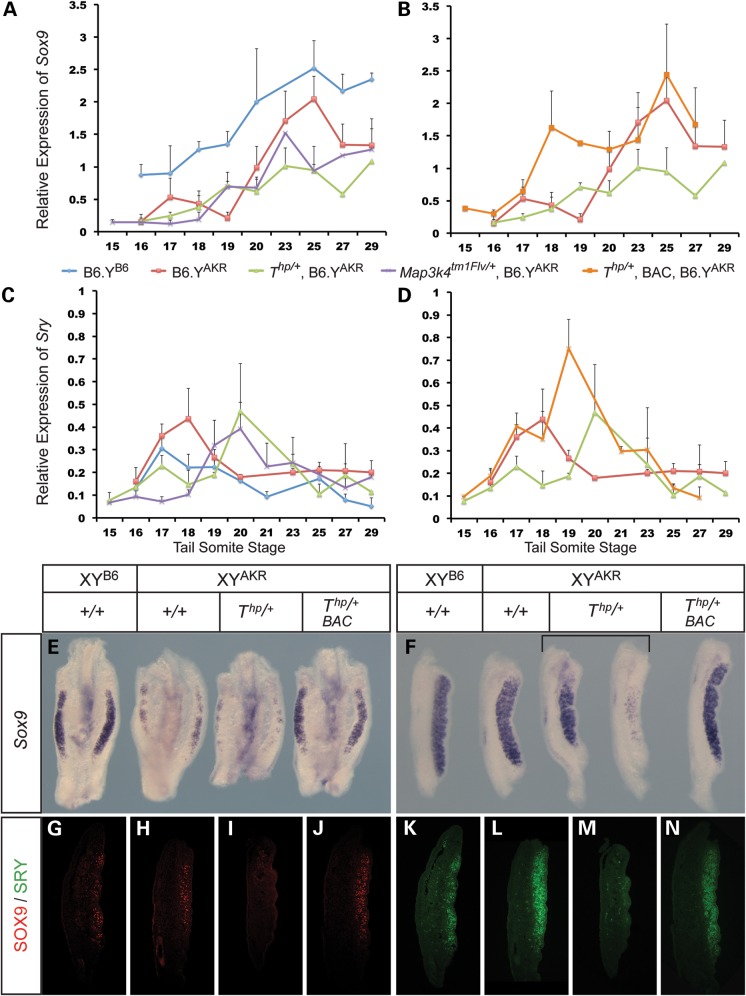
Expression profiling of Sox9 and Sry expression in XY Map3k4tm1Flv/+, Thp/+ and transgenic Thp/+ embryonic gonads. (A and B) Relative expression levels of Sox9 for different genotypes (indicated by colour key beneath plots) between 15 ts and 29 ts stages. (C and D) Relative expression levels of Sry in gonads from the same genotypic classes and stages as in A and B. Note the delay in peak Sry expression in Map3k4tm1Flv/+ and Thp/+ gonads (C) and the enhanced, early Sry peak in transgenic Thp/+ gonads (D). Error bars indicate standard error mean. (E) Sox9 WMISH analysis at 20 ts in genotypes as indicated. (F) Sox9 WMISH analysis at 27 ts (∼12.5 dpc) in genotypes as indicated. (G–J) Anti-SOX9 antibody immunostaining of control B6.YB6 (G), control B6.YAKR (H), Thp/+ (I) and rescued (BAC transgenic) Thp/+ (J) gonadal tissue sections at 18 ts. (K–N) Anti-SRY antibody immunostaining of the same series of 18 ts gonadal sections as in G–J.

