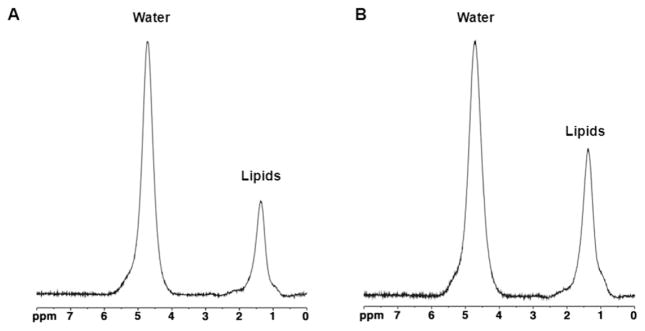
Figure 2.

1H-MR spectroscopy of bone marrow in a 40 year-old obese woman (BMI 34.9 kg/m2) before (A) and after (B) 6 months of GH administration. There is increased bone marrow lipid content following GH administration (0.44 vs 0.63 lipid-water ratio). For purposes of visual comparison, the amplitude of unsuppressed water was scaled identically.
