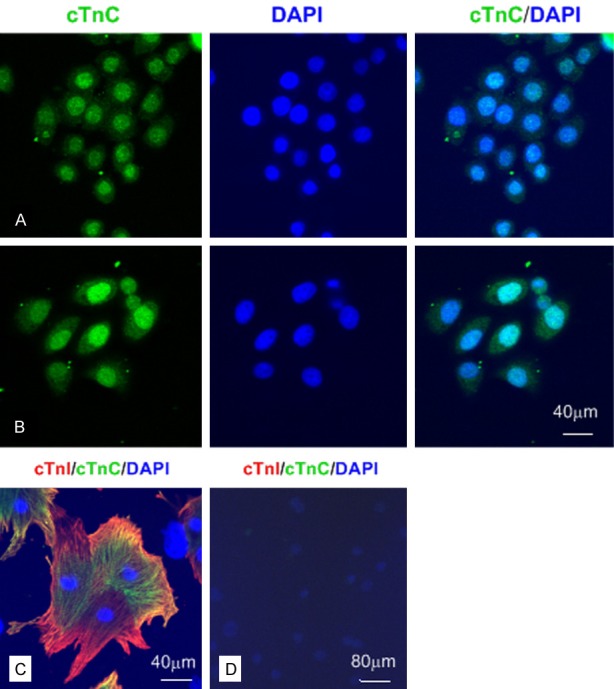
Figure 4.

The anti-cTnC mAbs could stain BGC 823 and SPCA-1 cells by IF. Representative confocal images of different cells (A-C: bar = 40 μm; D: bar = 80 μm). A: The positive nucleus staining for cTnC in BGC 823 cells. B: The positive nucleus staining for cTnC in SPCA-1 cells. C: cTnI and cTnC were co-expressed in cytoplasm of cultured neonatal rat cardiomyocytes. D: cTnI and cTnC were negative staining in cultured rat endothelial cells.
