
Figure 2.
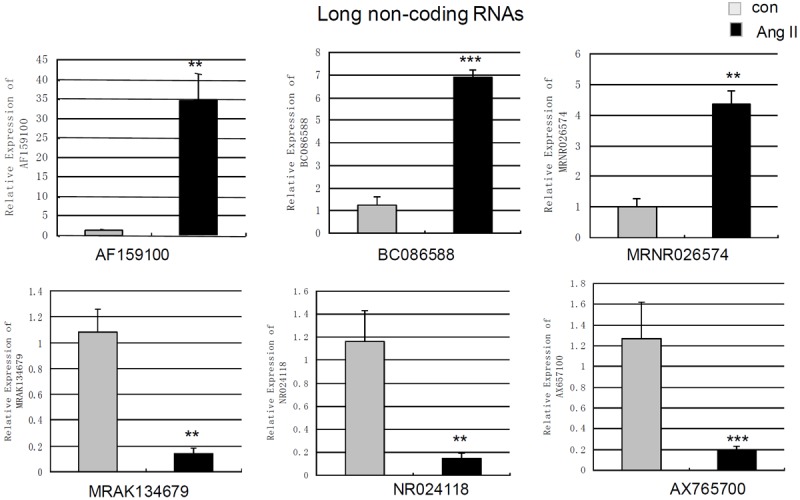
Measurement of changes in long non-coding RNAs using qPCR. The expression levels of AF159100, BC086588, MRNR026574, MRAK134679, NR024118, AX765700 in cardiac fibroblasts treated by angiotensin II-treatment (100 nm 24 h) and control cells were measured by qPCR. Expression of lncRNAs was normalized to GAPDH expression. Data are the mean ± SEM (n=6). P<0.05 was considered to indicate a statistically significant difference compared with control fibroblasts.*p<0.05, **p<0.01 and ***p<0.001.