
Figure 3.
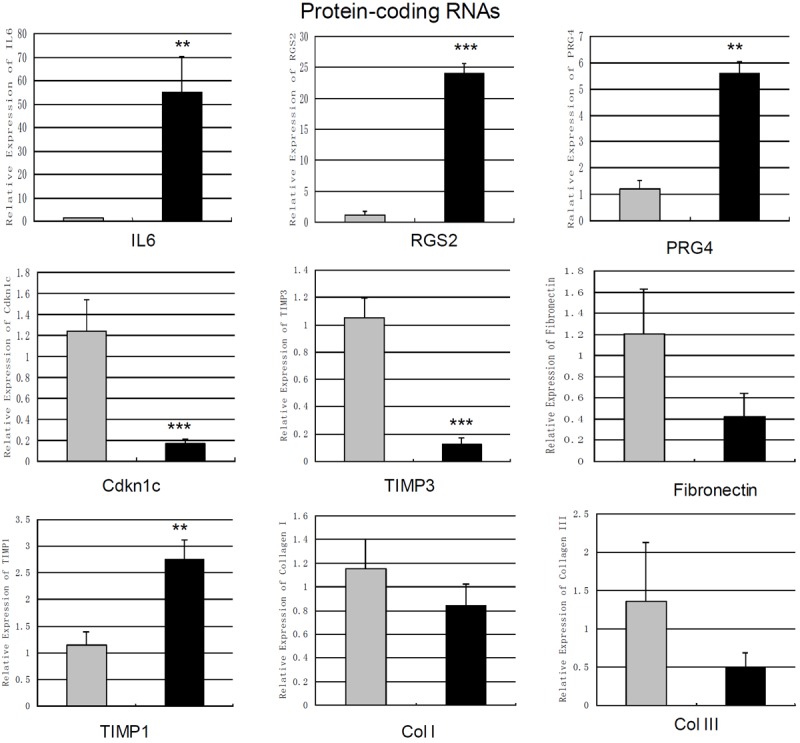
Measurement of changes in protein coding mRNAs using qPCR. The expression levels of IL6, RGS2, PRG4, TIMP1, Cdkn1c, TIMP3, Col I, Col III and Fibronectin in cardiac fibroblasts treated by angiotensin II-treatment (100 nm 24 h) and control cells were measured by qPCR. Expression of mRNAs was normalized to GAPDH expression. Data are the mean ± SEM (n=6). P<0.05 was considered to indicate a statistically significant difference compared with control fibroblasts.*p<0.05, **p<0.01 and ***p<0.001.