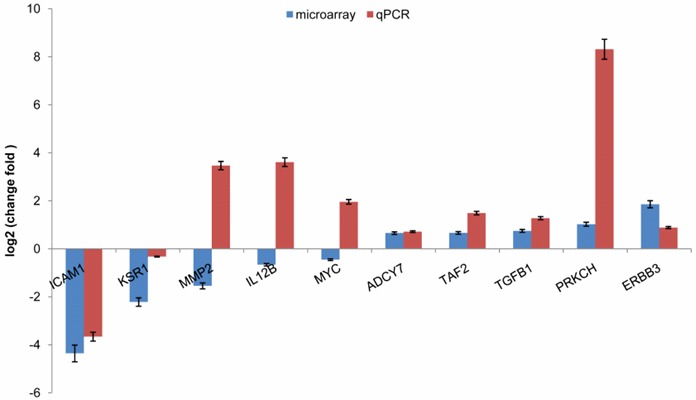
Figure 3.

qPCR validation of microarray data. The expression fold change of genes in a PTX-resistant GC cell line (NCI-N87) was calculated relative to a PTX-sensitive cell line (BGC-823). The error bar represents the standard deviation (SD). The fold change was log2 transformed such that a gene with a value of log2 (fold change) larger than zero was highly expressed in the PTX-resistant GC cell line.
